
Tutorials
Usage: where your interviews went
The Usage tab in workspace settings accounts for every billable interview, grouped by project, by person, or by study, over whatever date range you ask for, and exportable as CSV.
The question comes up at the end of every month: we bought 500 interviews: who used them, and on what? Until now the answer meant asking around. The Usage tab answers it directly.
Open Settings, then pick Usage under Workspace. You'll need to be a workspace owner as this is a whole-workspace view of a whole-workspace allowance, so it isn't there for anyone else. If you can't see it, ask an owner on your team.
It replaces the old Project usage tab, and it widens the view: where that tab could only show one project at a time, this one accounts for every project at once.
One thing to say plainly, because it governs every number on the page: the unit being counted is a completed interview. An interview counts once it has finished and been processed and not when a study is created, not when a Synthetic Users is generated. Everything on this tab is that same count, sliced differently.
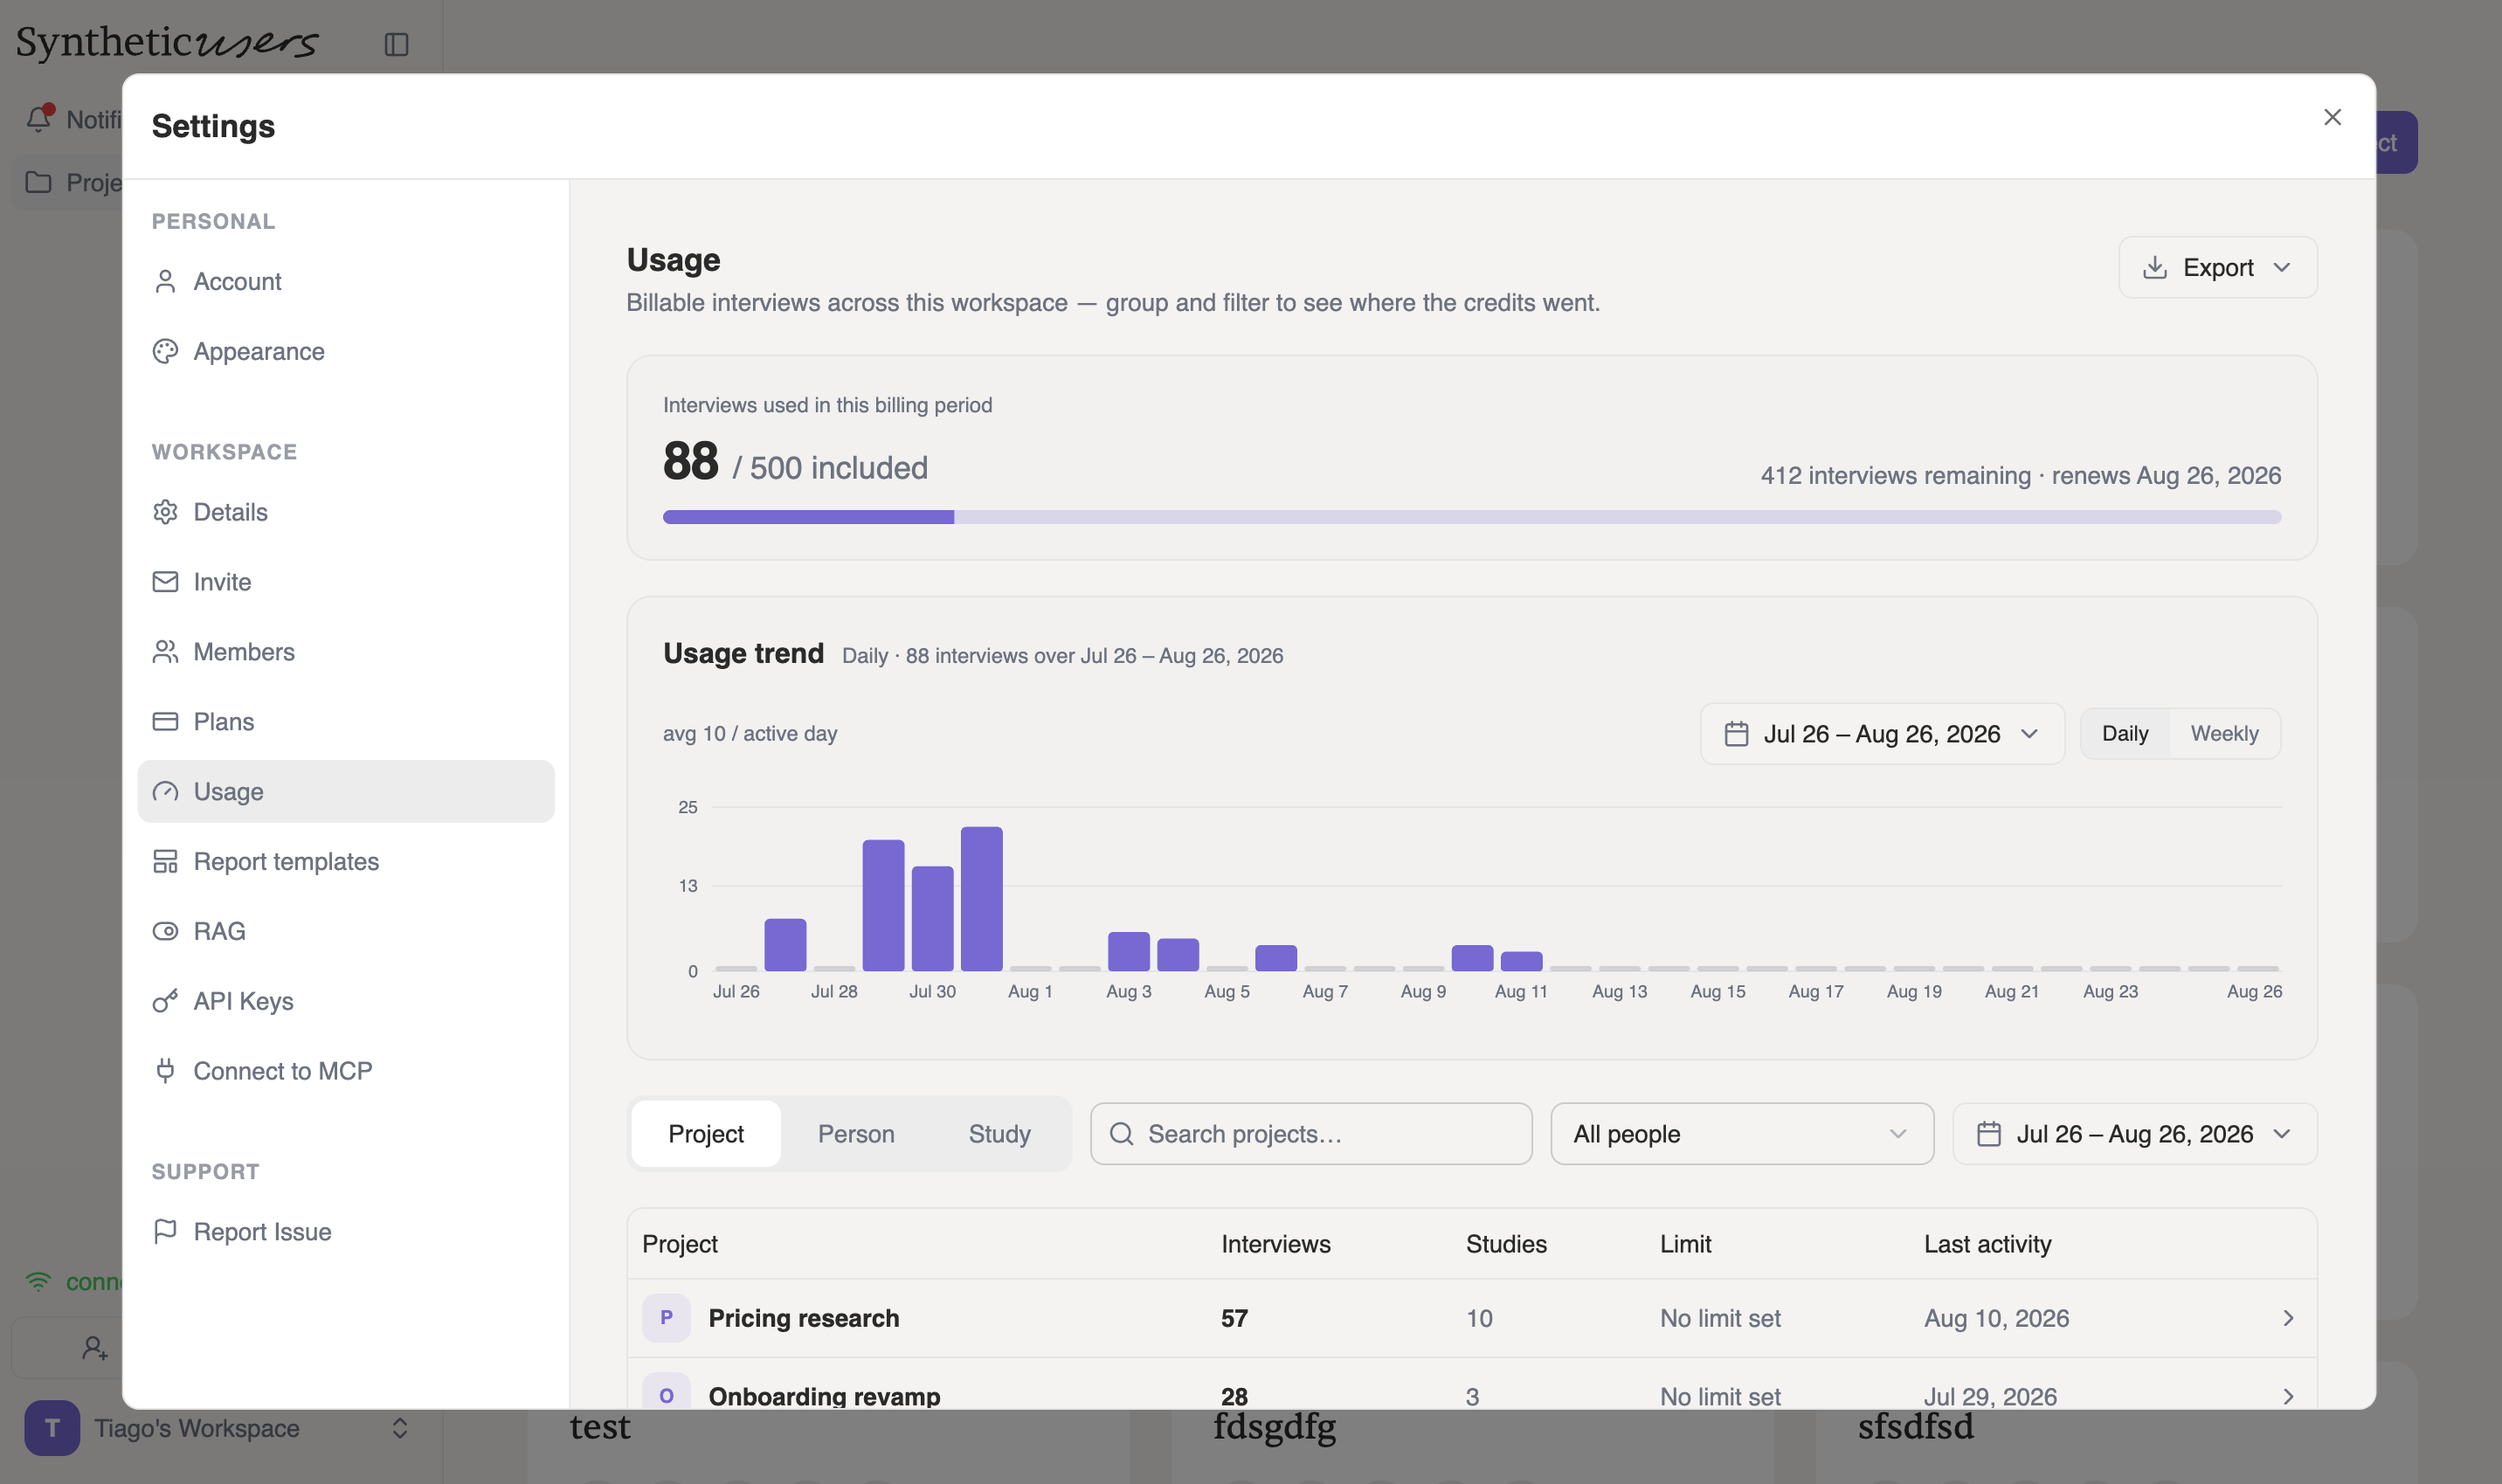
- Plan header Interviews used in the current billing period against what the plan includes, how many remain, and the date the allowance renews. This is the same count the platform uses to decide whether you can run another study, the tab never disagrees with the gate.
- Usage trend Interviews per day across the range, zero-filled so quiet days stay visible as gaps rather than being squeezed out. Toggle Daily or Weekly, and hover a bar for the exact count and its share of the range.
- Group by Project, Person or Study. Same interviews, three questions: which work consumed them, who ran it, and which individual studies.
- Search, people, range Narrow to one project, one member, or one window of time. The search box follows whatever you're grouped by, so it searches projects, people or studies in turn.
- The table One row per project, person or study, with its interview count and when it was last active. Project rows also carry the project's interview limit, editable in place.
“This period” is your renewal date, not the calendar month
The default range is This billing period, and it runs from your subscription's anniversary, not from the 1st. Most plans are yearly and most of them started mid-month, so a calendar month would have shown a number that disagreed with the plan header and with the quota gate. The anniversary is the one window where all three agree.
From the range picker you can also choose Last 7 days, Last 30 days, All time, or a Custom range, click a start date, then an end date, and it commits.
The chart and the table keep their own ranges on purpose: it's useful to read a year-long trend while inspecting one week's rows. When they differ, a Match graph range / Match table range shortcut appears to snap them back together.
Three ways to slice it
The grouping tabs are the heart of the tab. Each row expands, and what it expands into is the other half of the answer.
- By project Interviews, number of studies, the project's limit, and last activity. Expand a row for Interviews by person the breakdown of who spent them inside that project.
- By person Interviews, studies, how many projects they touched, and last activity, with an Admin or Member badge. Expand for Interviews by project where that person's interviews went.
- By study The finest grain: interviews, the project it belongs to, who ran it, and when it last ran. Study rows don't expand, clicking one opens the study itself.
A study appears here because it consumed at least one billable interview. That is also, exactly, the definition of spend, which is why nothing is filtered out for still being in flight.
Set a project's limit without leaving the table
Project rows show the interview limit next to the usage, so the number and the cap sit side by side. No limit set means that project can draw on everything the plan includes; that's the default, and it's the absence of a limit rather than a kind of limit.
To change it, use Set interview limit (or Edit interview limit) on the row. Switch a cap on, then choose whether it's a Lifetime total or a Monthly allowance. Monthly caps are available on yearly plans. The editor shows what the project has already used, so you're not setting a cap below the current count by accident.
The table only lists projects with usage in the range. A brand-new or quiet project won't have a row to edit. For those, the limit chip at the top of the project itself opens the same editor.
Export it
The Export button in the top right writes a CSV. You pick two things:
- What to group by Current view keeps the grouping, search and people filter you're looking at. Or export By project, By person or By study outright.
- Which range Current view, This billing period, or All time.
The columns follow the grouping: Project, Interviews, Studies, Limit, Last activity; Person, Interviews, Studies, Projects, Last activity; or Study, Interviews, Project, Run by, Last run. It's the same shape as what's on screen. The spreadsheet you send to finance and the table you're reading are the same numbers.
Deleted work still counts
Deleting a study or a project doesn't refund its interviews, they were run, so they still count against the plan. Rather than quietly dropping them and showing you a total lower than what you were charged, the table keeps those rows and badges them as deleted. A deleted project's limit is no longer editable, because there's nothing left to cap.
If the workspace total looks higher than the studies you can still see, this is usually why. The interviews behind a deleted study are spent, and honest accounting has to show them.
One tab, one definition, and a CSV at the end of it. If a number here doesn't match what you expected, tell us at support@syntheticusers.com. A disagreement between this table and your own count is something we want to know about.