
Tutorials
Run 300 synthetic users at once
Scripted studies now run up to 300 synthetic users. How to set one up, what changes while it runs, and how to read the numbers at the end.
A study used to top out at 20 synthetic users. A scripted study can now run up to 300, all asked the same questions, and the Summary adds up the answers for you: how many people said each thing, with the quotes behind every number.
This walkthrough takes one study from an empty planner to a summary you can share, in eight steps: three to set it up, five to run it and read it.
Step 1
Give the study a custom script
A big study needs two things: a custom script and an audience built in the Audience Crafter. Start with the script. Add a Custom script node to the planner and write the questions everyone will answer.
The script is what makes 300 answers worth counting. When everyone gets the same questions, "how many chose A" is a real number.
- A script and a Crafter audience Up to 300 participants.
- User testing, one-at-a-time concepts and video concepts Up to 20.
Step 2
Build the audience
Open the Audience Crafter and describe who you want, or pick an audience you saved from it. The Crafter splits them into segments, such as cities or age groups.
Give each segment a percentage of the study.
Anything over 20 people needs a Crafter audience, because its segments are what you'll filter and compare people by later.
Step 3
Set the size and the split
On the Participants node, type how many people you want, up to 300. Your percentages are turned into people for you. To split them differently:
- Even The same number in every segment. Best when you want to compare groups.
- Proportional Each segment sized like the real population. Best when you want the whole study to look like the market.
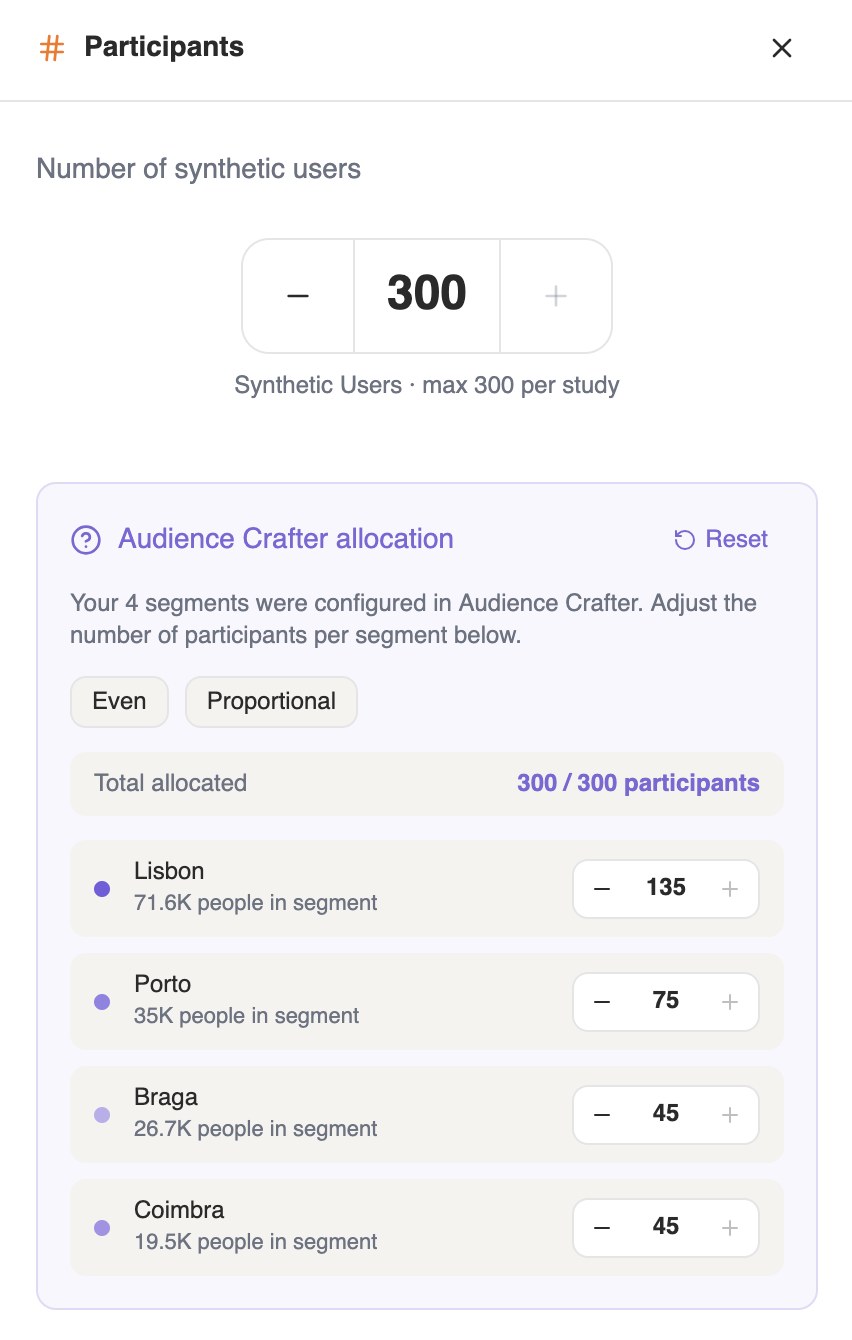
You can change any segment's number by hand, and Reset takes you back to your percentages. The number can't go above the interviews left on your plan.
Step 4
Generate the participants
Each participant is built from real population data, so ages, genders and places look like the real population instead of 300 versions of the same person.
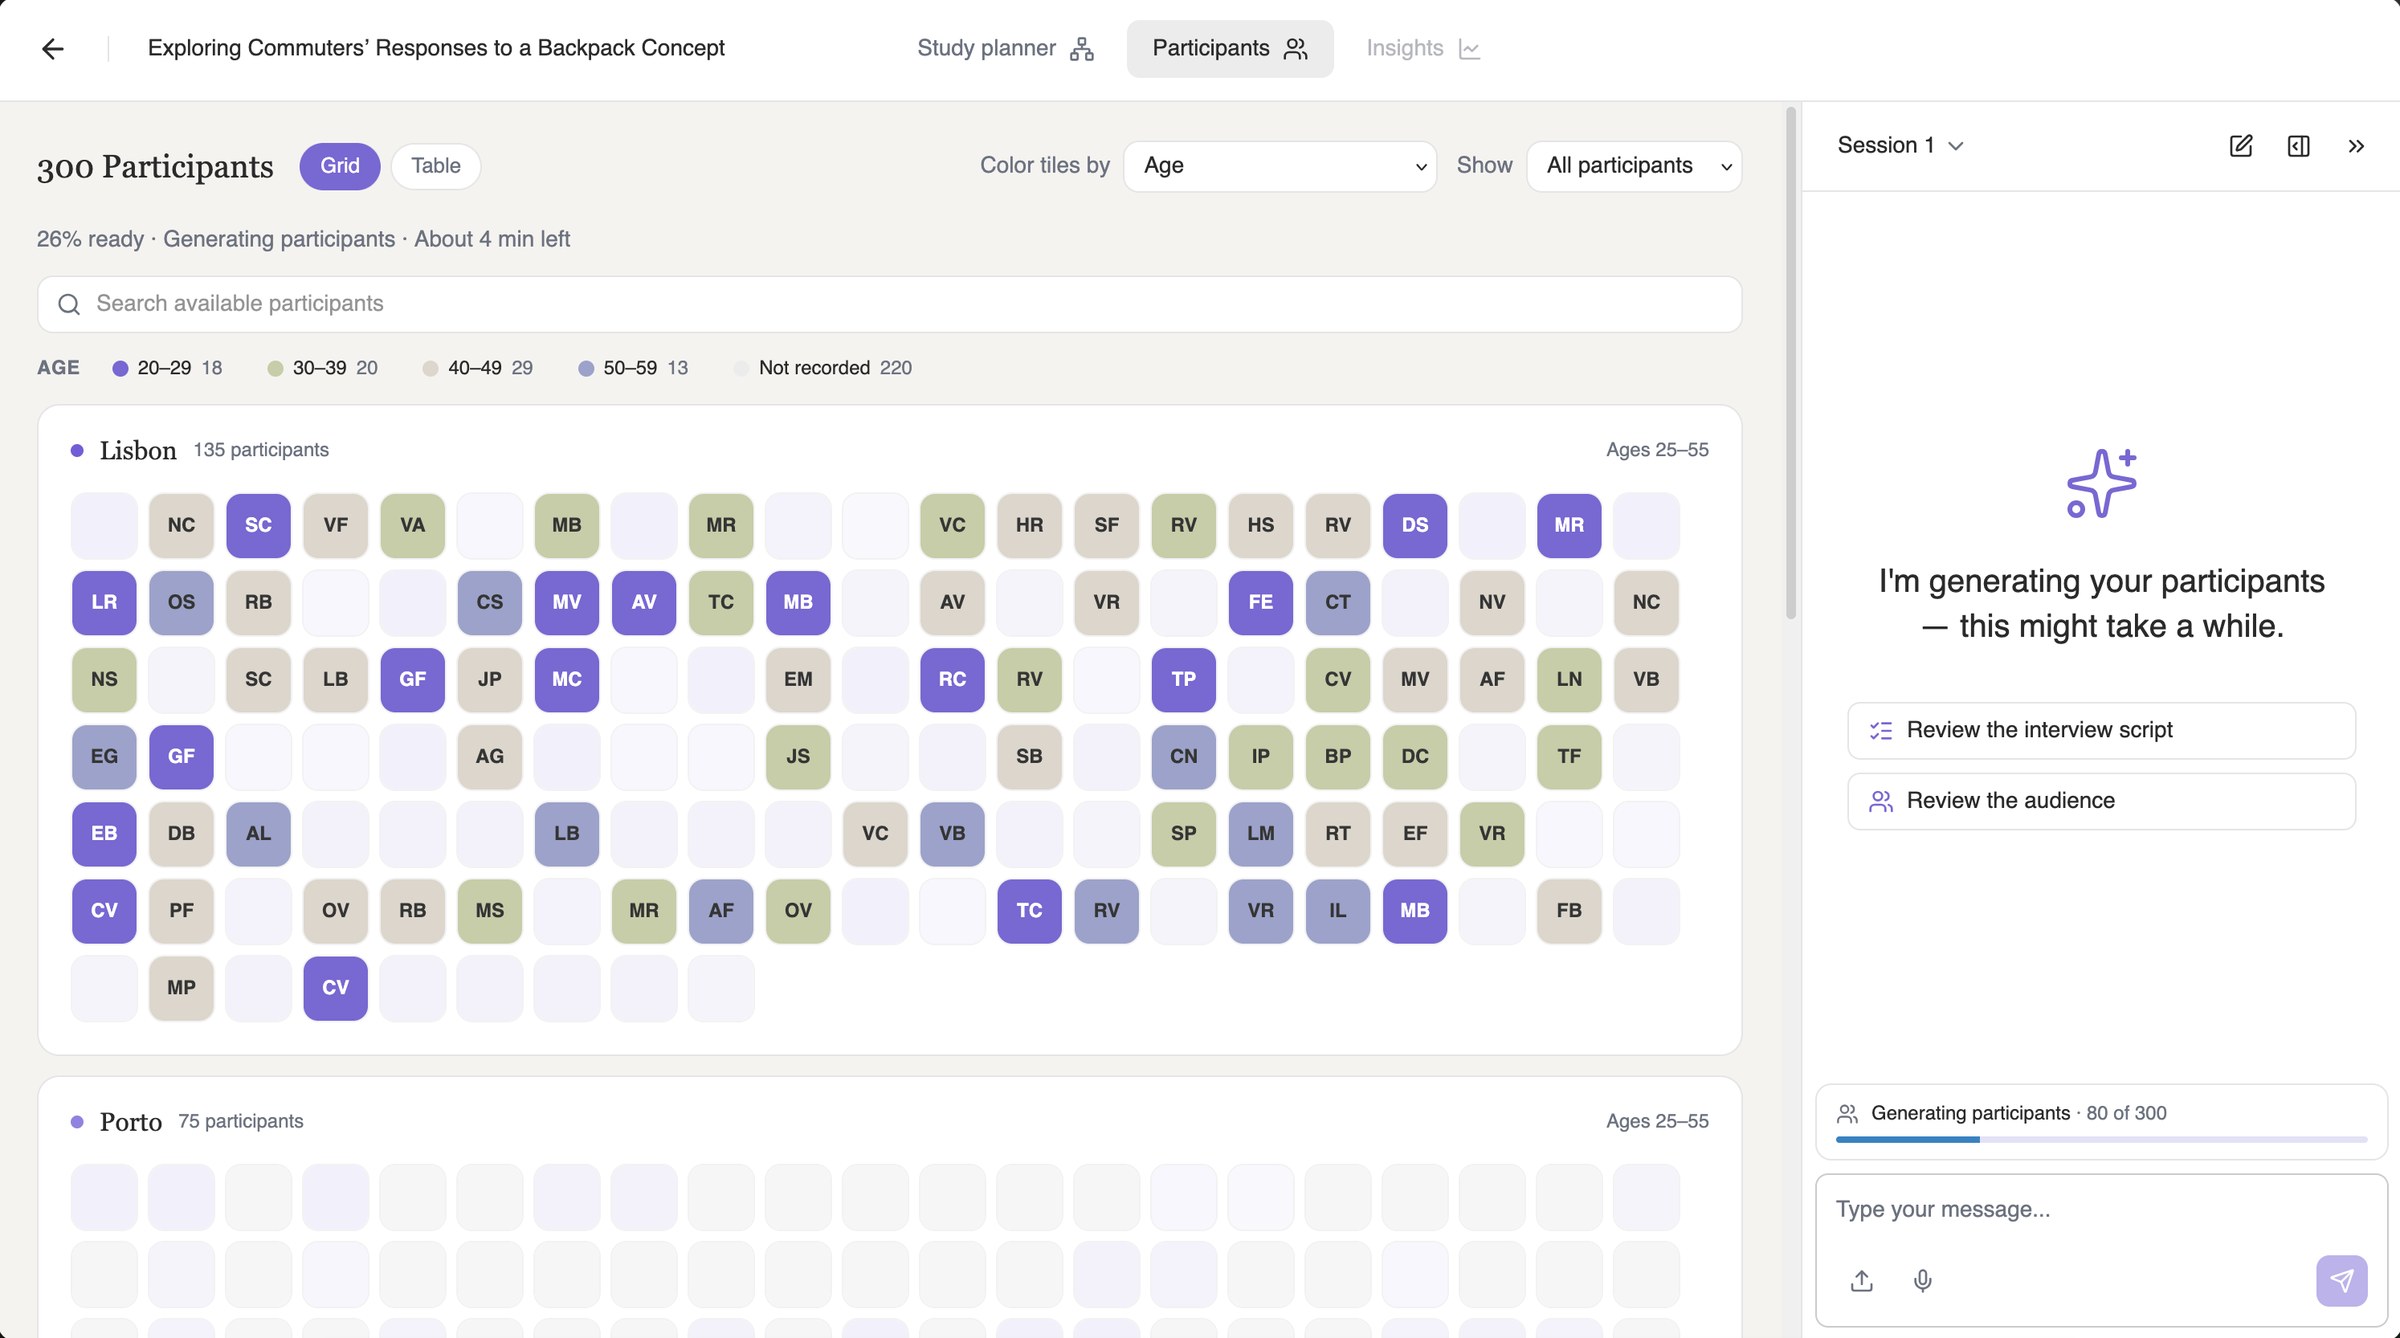
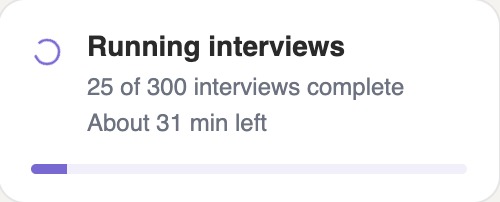
A few hundred people take a while, so the page shows how long is left. If Research the web is on, that runs first. You can leave the page; it keeps going without you.
Step 5
Browse the cohort
The Participants tab shows everyone, in a grid or a table. With 300 people, filters help:
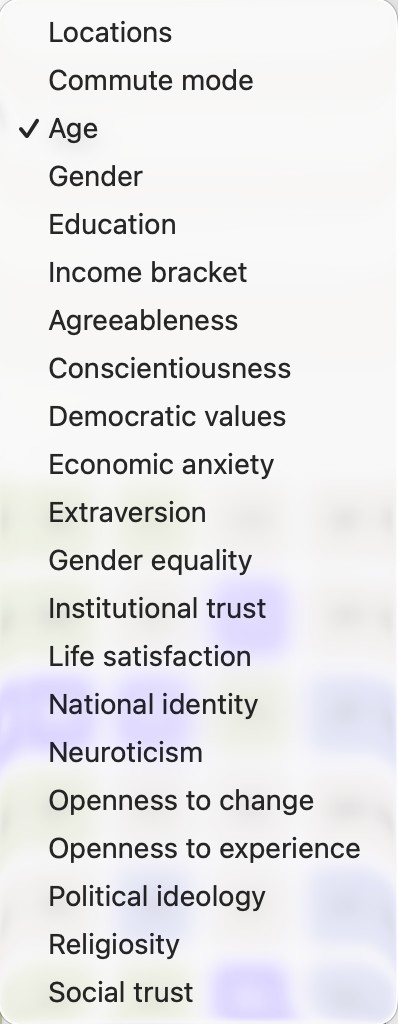
- Filter Pick something, like age or city, then the values you want to see. The colour key sits next to the filter.
- Your own segments What you split the audience by in the Crafter, like Locations or Commute mode, is there to filter and colour by.
- Search By name, or by exact age.
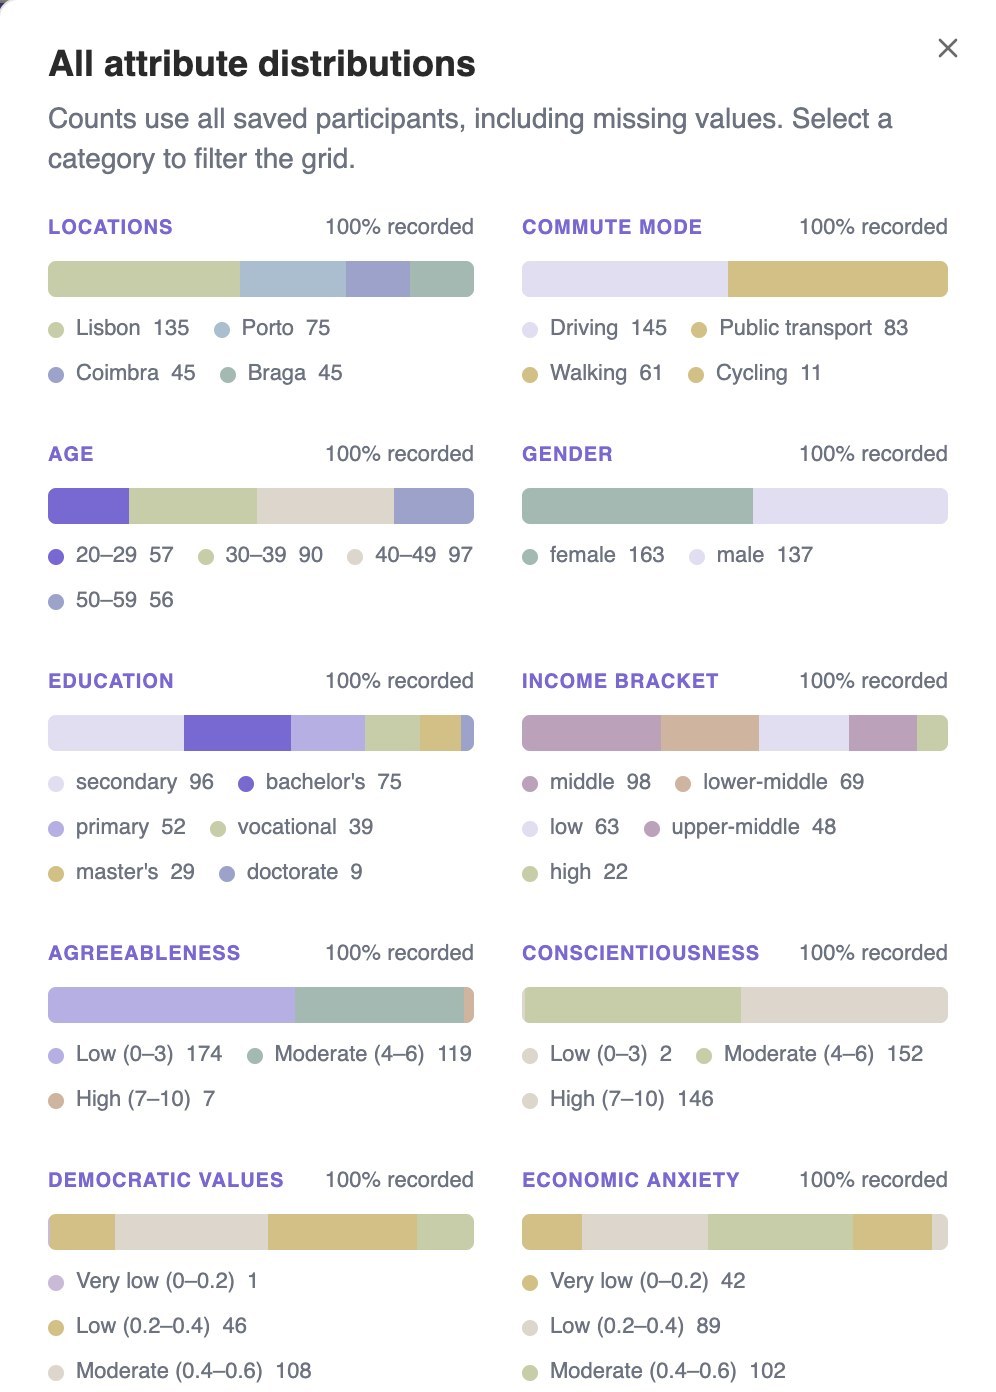
Click anyone to read their full profile.
Step 6
Run the interviews
Everyone gets one interview, on your script. You can see how many are done, how many are running, and how long is left.
Big studies run in batches, not all at once. In each interview, the concepts a question showed sit side by side with their names.
Step 7
Read the Summary
This is where 300 people pays off. The Summary is built once the interviews finish, and it starts with the numbers:
- At a glance How many people took part, how they split across your segments, how many questions were covered, and the theme people raised most.
- Key findings Each one shows how many people it applies to, like 68% · 204 of 300. Similar findings are grouped, so you get a short list, not eighty.
- Question by question How everyone answered each question, in percentages, and which segments answered differently.
- Different perspectives and recommendations Where people disagreed and by how much, and what to test next.
Every finding opens the answers behind it, so you can always read what people actually said.
These numbers count what synthetic participants said. Read them as how common a view is in the audience you built, not as survey results with a margin of error.
Step 8
Compare groups in Findings
The Findings tab answers the question a big study makes possible: who thinks differently? Pick a comparison, like age, gender or segment, and every finding is ranked by how differently the groups answered, biggest gap first.
Open a finding to see who said it, and save the people you want as a reading set to come back to.
Then keep going
Two more things work at this size. Ask a follow-up sends a new question to everyone, to one segment, or to a group like an age band. Their original interviews stay as they were, and the Summary tells you when there are new answers to add. Download summary gives you a PDF with the same numbers, ready to share.