
Tutorials
The Audience Crafter, rebuilt
Describe who you're looking for, watch the audience take shape, and trust the number at the top of the screen.
The Audience Crafter lets you build a research audience by describing it. This release changes four things about that: the assistant now works on your canvas step by step instead of in one lump at the end of its reply; the size holds still when you change how you're looking at the audience; you can say how a criterion's values combine; and you can draw age bands wherever you want them, gaps included.
The quickest way to show all of that is to build one audience from beginning to end. So that's what this is. We'll take a real recruitment brief for Hearth, a meal-kit subscription in Spain, and turn it into a set of segments and a sample of synthetic users ready to interview. Eight steps, and you can stop at any of them.
Step 1
Open it from your study
The Audience Crafter is how a study gets its people, and it lives on the Audience node of the study planner.
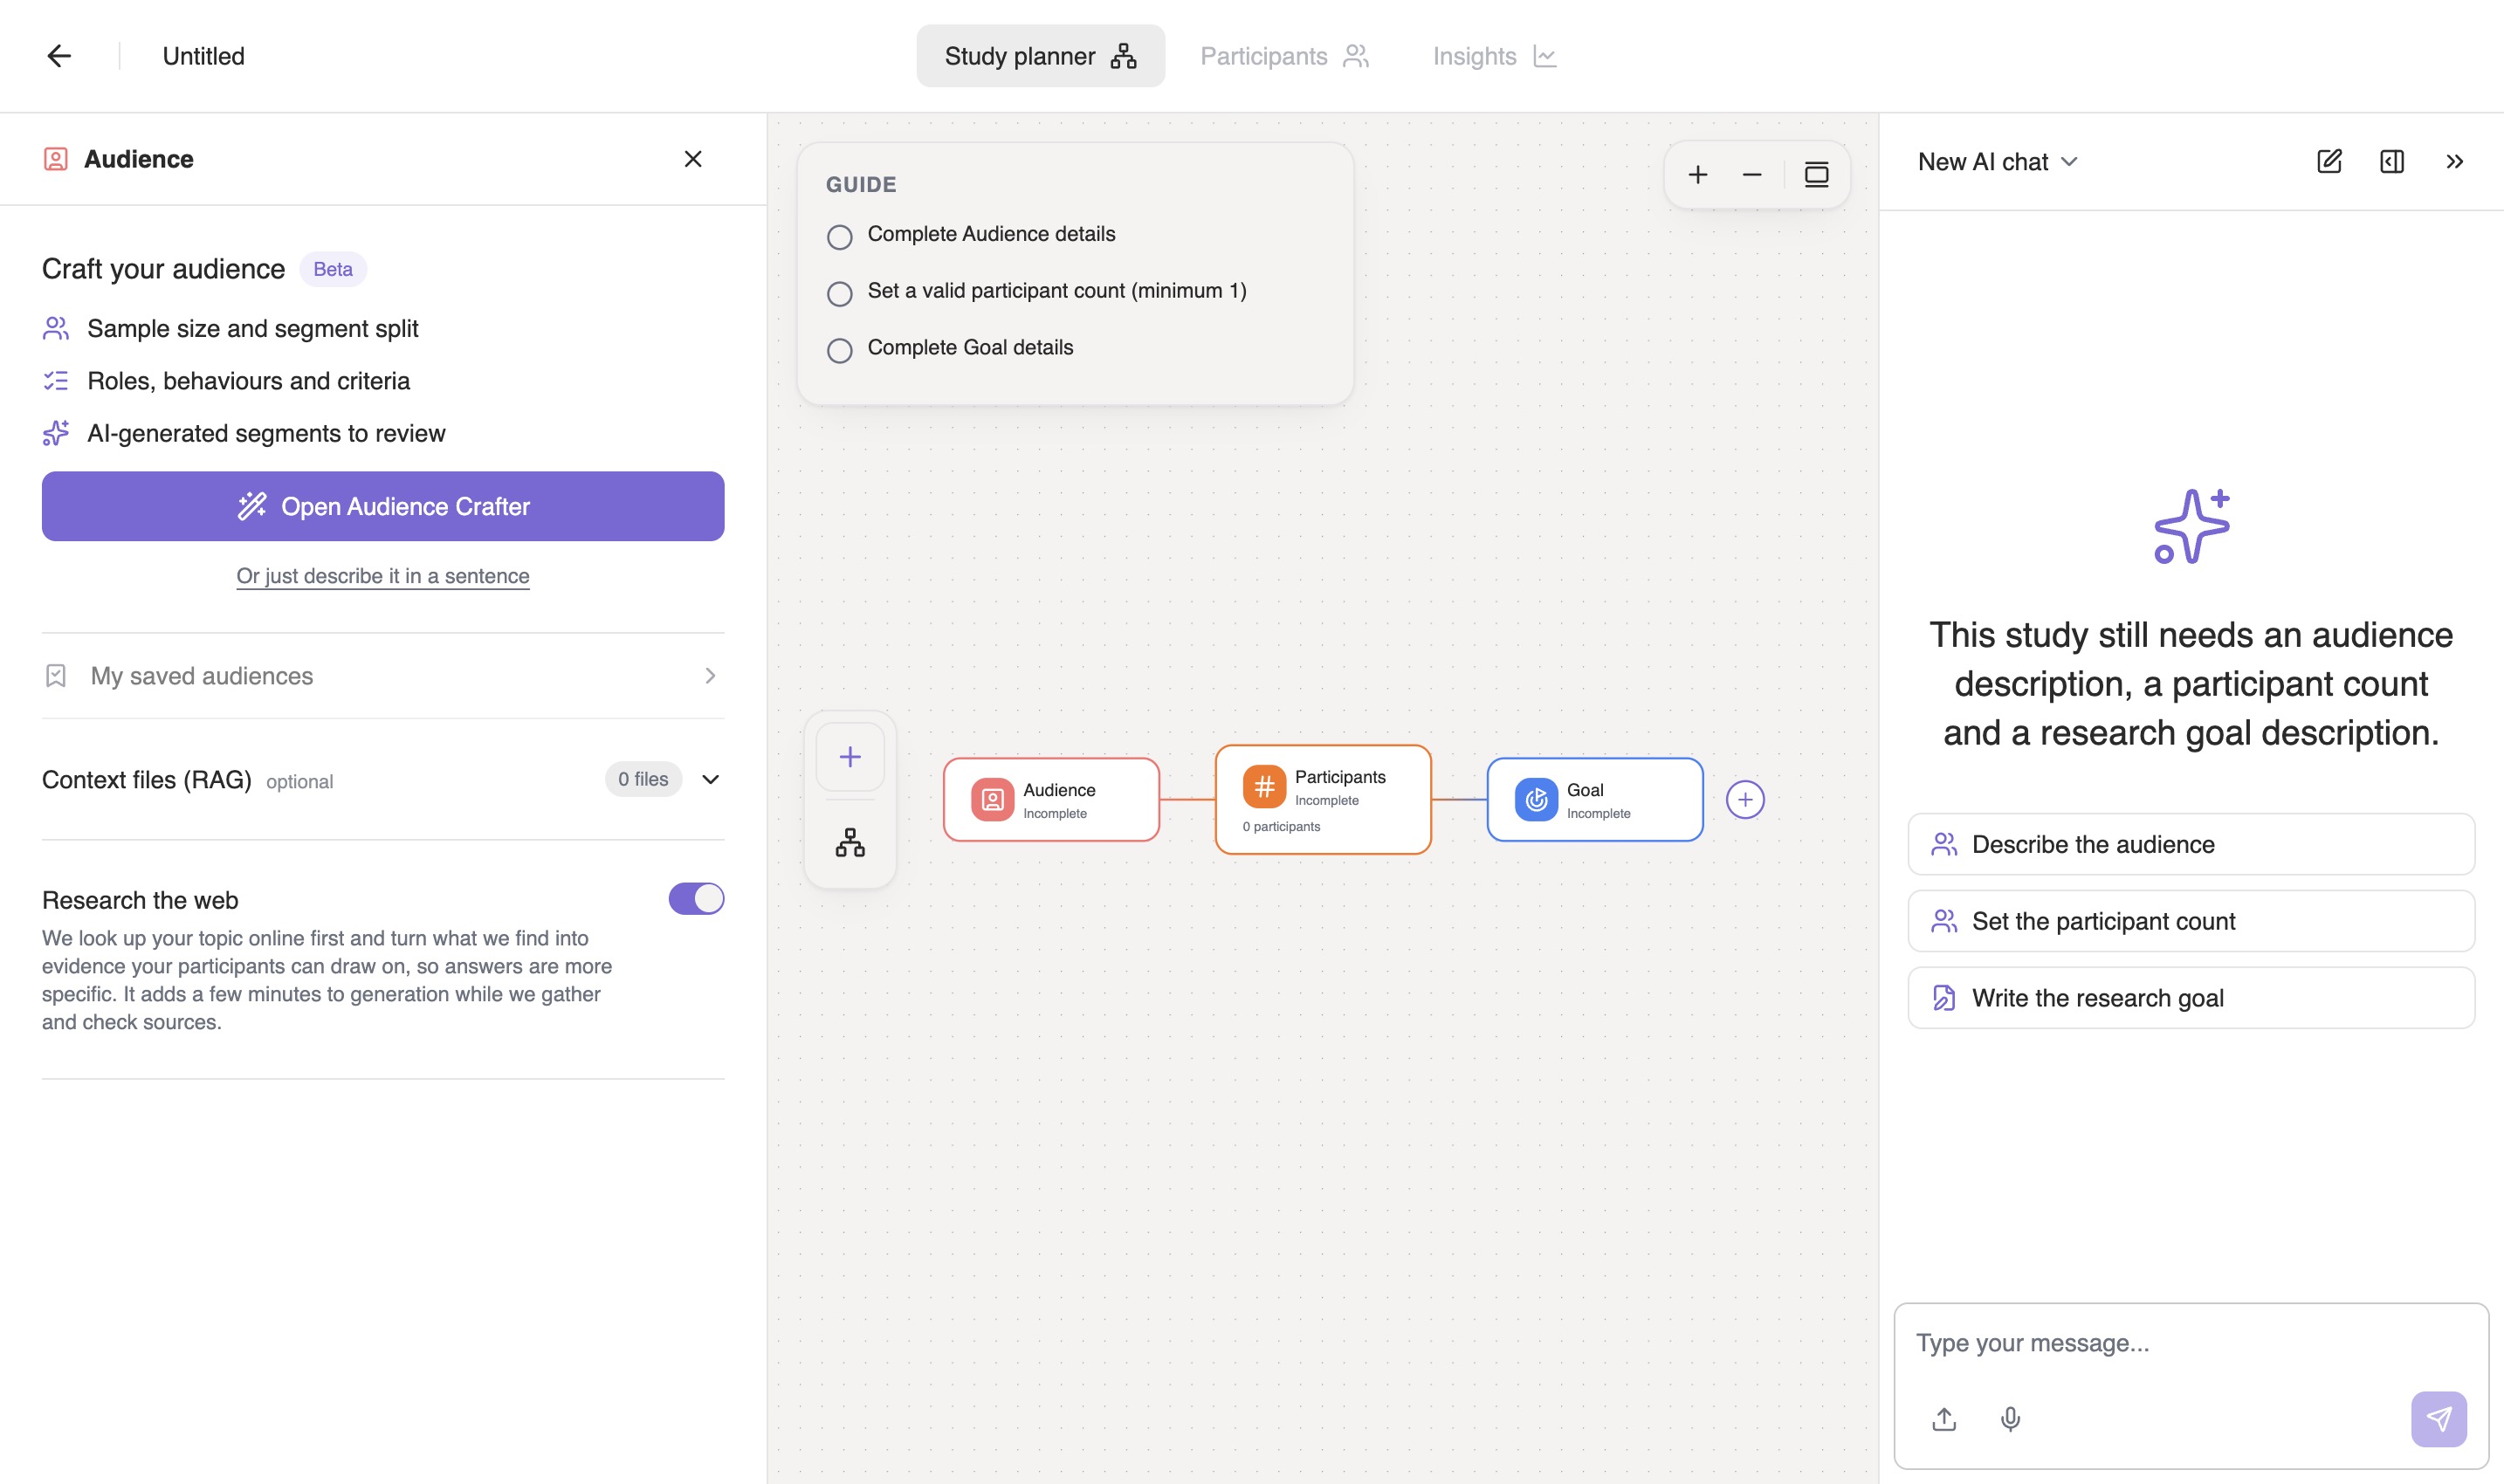
Open the node and it tells you what the Crafter covers: sample size and segment split, roles, behaviours and criteria, and AI-generated segments for you to review. From here there are three ways forward, and they're worth knowing apart:
- Open Audience Crafter The full canvas. Take this one if you have a real brief, or if you want to see the size of what you're asking for while you ask for it. It's the route this walkthrough uses.
- Or just describe it in a sentence The short path, for when you already know exactly who you want and don't need the maths.
- My saved audiences An audience you built before. They're reusable across studies, so a good one is worth building properly once.
Two more controls sit further down the same panel, and they answer a different question. Context files (RAG) and Research the web decide what your participants know, by grounding them in your own documents or in evidence we go and find on the web. The Crafter decides who your participants are. Different job, and you can use both.
Step 2
Drop in your brief, or start by hand
The Crafter opens in two halves: the conversation on the left, the audience on the right. The right-hand side is empty, and it stays empty until you've said who you're after. That's deliberate. It would rather show you nothing than a number it can't stand behind.
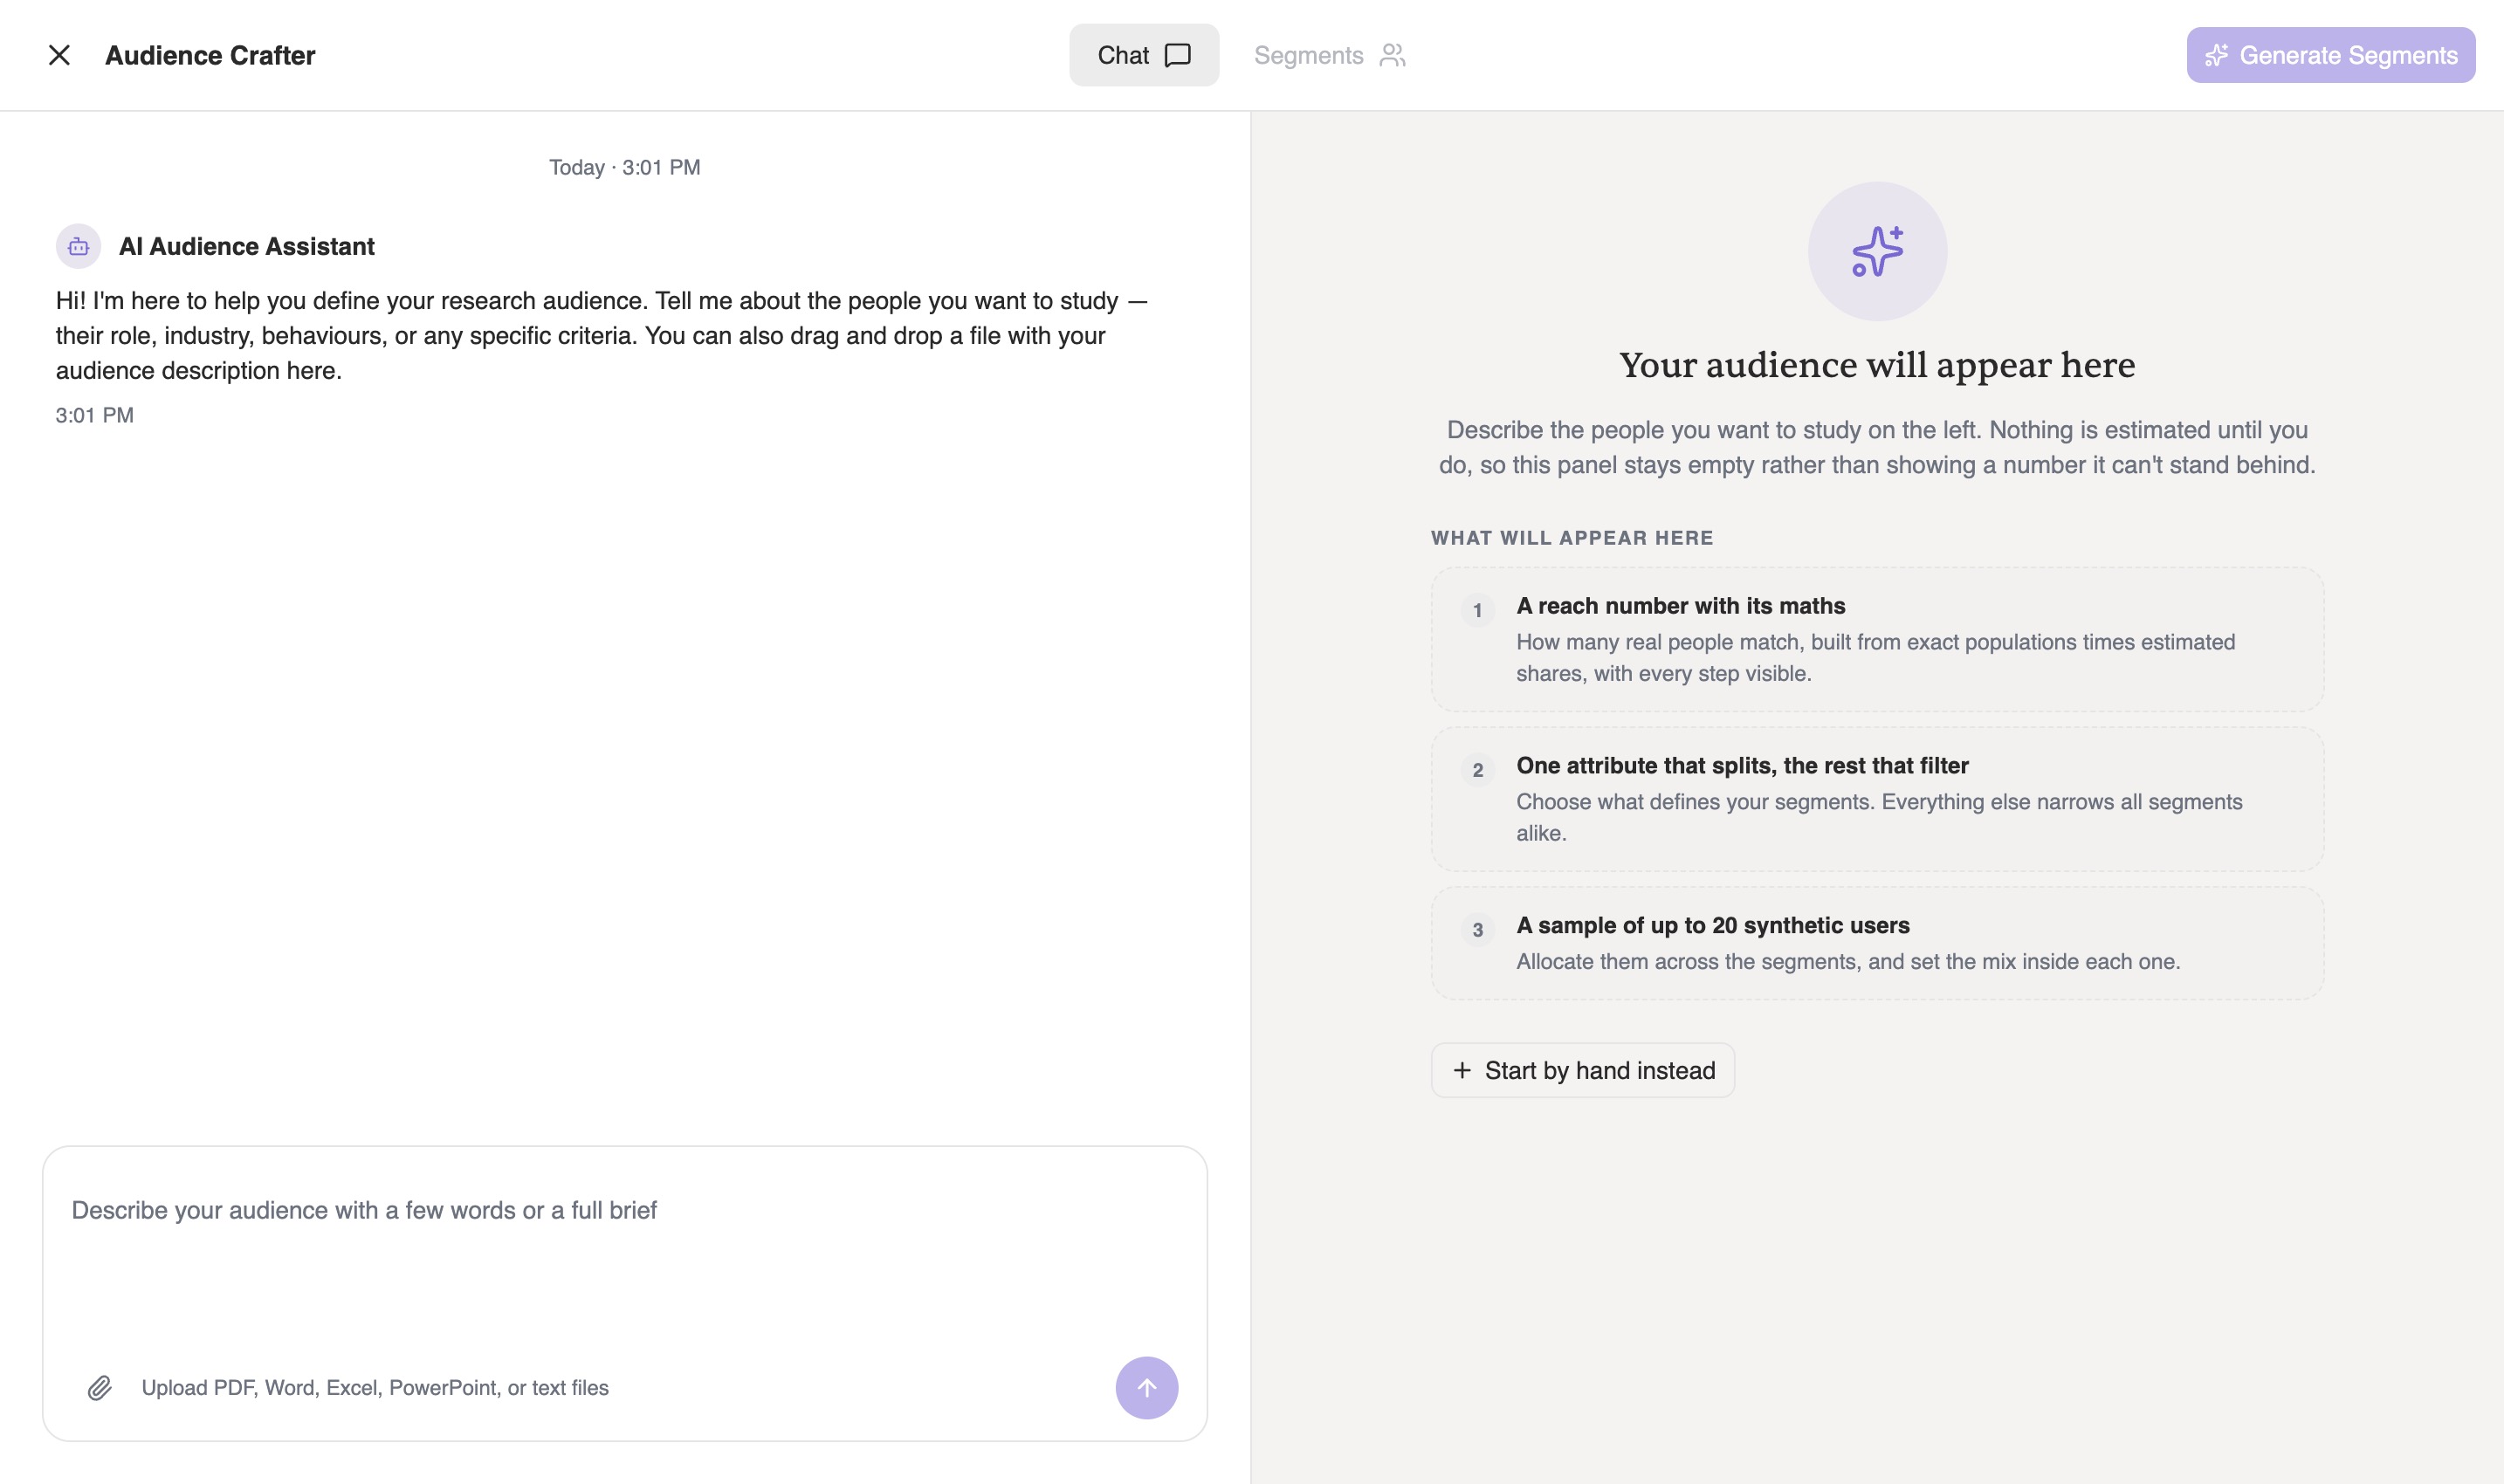
What you'll get for it is set out before you've typed anything: a reach number with its maths, one attribute that splits your audience while the rest filter it, and a sample of up to 20 synthetic users allocated across the result. Those three things are the rest of this post, in order.
Four ways to begin
- Drag in a file A PDF, Word, Excel, PowerPoint or text file holding your audience description. The assistant says so in its opening line, because it's the route that loses the least: everything you already wrote down stays written down. This is what we do next.
- Paste the brief Same thing without the file. A full screener pasted into the box is read exactly as carefully.
- Type a few words "Hearth subscribers in Spain, 25 to 55" is a perfectly good start. You can fill in the rest by talking, or by hand.
- Start by hand instead Skip the conversation and add criteria yourself. The chat is one of two ways to do the same thing, and neither wins.
Nothing downstream cares which route you took. An audience built by dropping in a document is the same object as one built chip by chip, and you can switch between the two at any point.
Step 3
Hand it the brief
Here we've dropped in the recruitment brief and asked for the obvious thing.
Build the audience from the attached file.
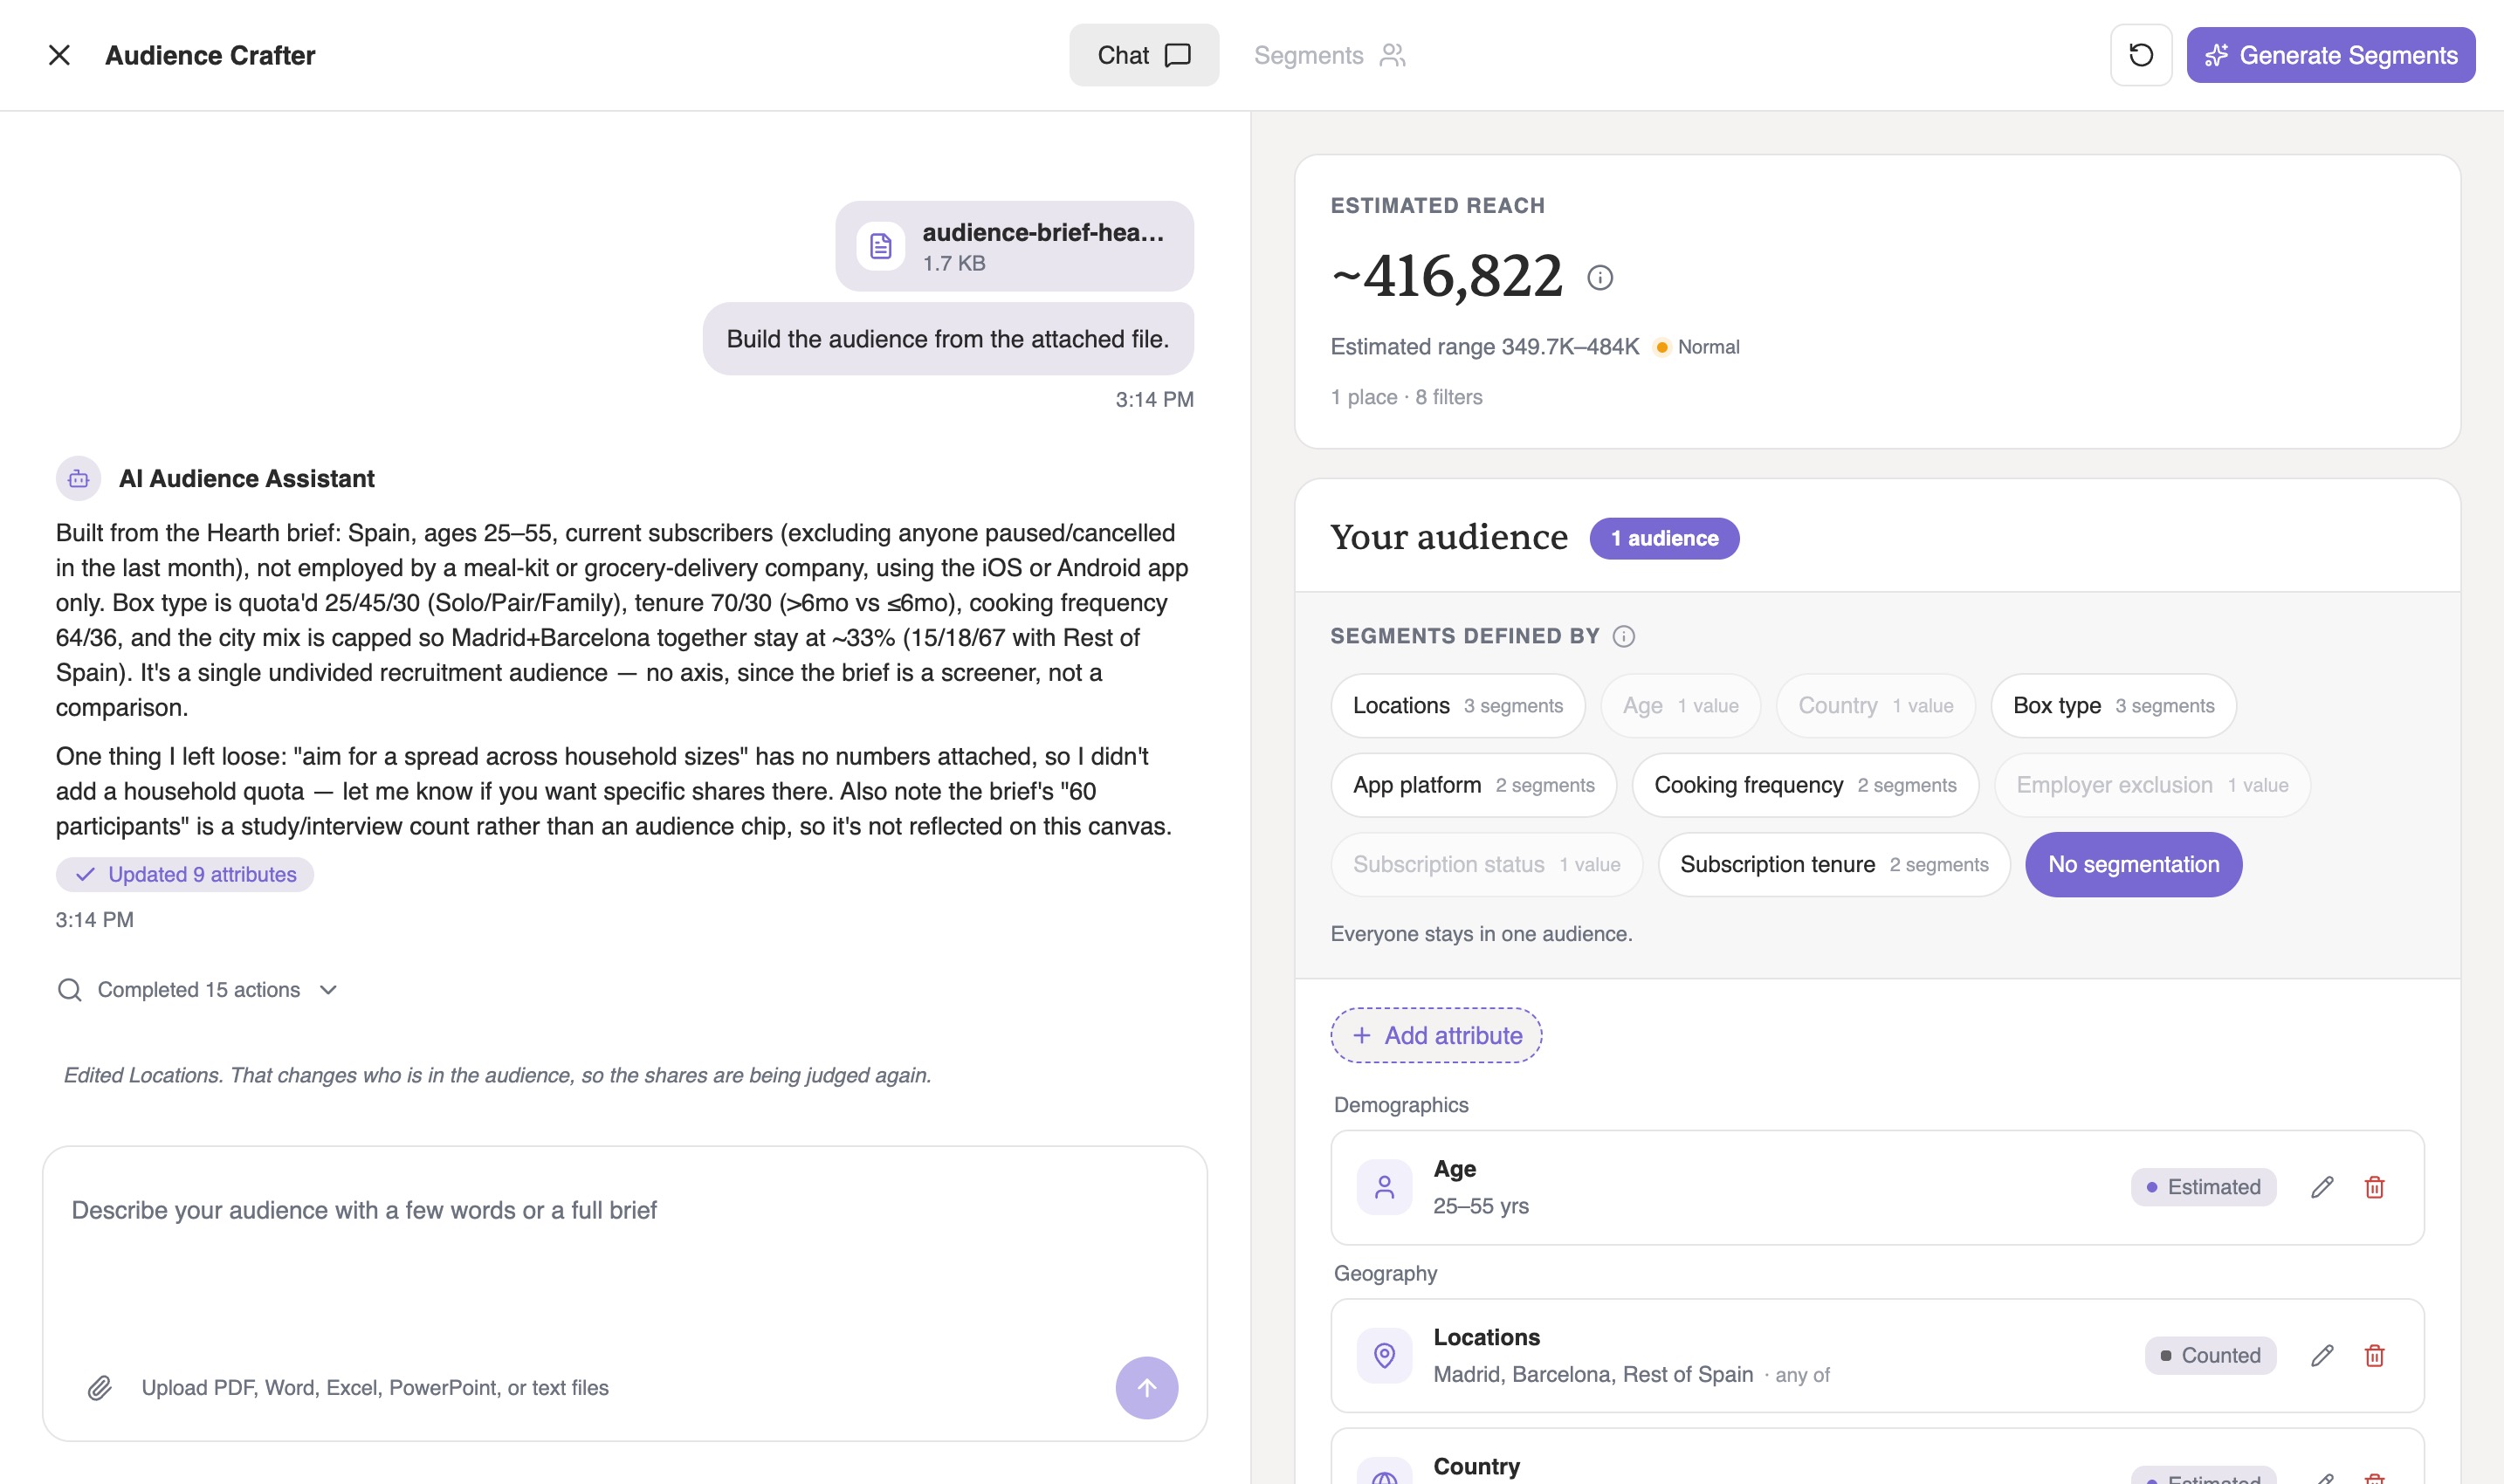
What's different is what happens while it replies. Each change lands as its own visible action, adding a criterion, setting a split, working out the size, rather than everything arriving at once when the turn ends. Completed 15 actions expands if you want to read them. You can see which part of what you said produced which chip.
It also tells you what it didn't do. Here it flagged that "aim for a spread across household sizes" had no numbers attached, so it added no household quota, and that the brief's "60 participants" is an interview count rather than an audience criterion, so it doesn't belong on the canvas at all. Reconciling a brief with what the platform actually supports is part of the assistant's job: it resolves what it can on its own, and surfaces anything it can't, in the same reply.
- The number comes with its own caveats An estimated range (349.7K–484K here), a confidence reading, and a one-line summary of what produced it: 1 place · 8 filters.
- Nothing is hidden behind the summary Every attribute the assistant created is an ordinary chip on the right, open to editing, the same as one you added yourself.
Step 4
Decide what splits the audience
This is the one concept worth slowing down for, because everything else follows from it. One attribute splits your audience into segments. Every other attribute filters all of them alike.
Segments defined by is where you choose which one. Pick Locations and you get a segment per place. Pick Box type and you get a segment per box. Pick No segmentation and everyone stays in one undivided audience, which is the right answer when your brief is a screener rather than a comparison.
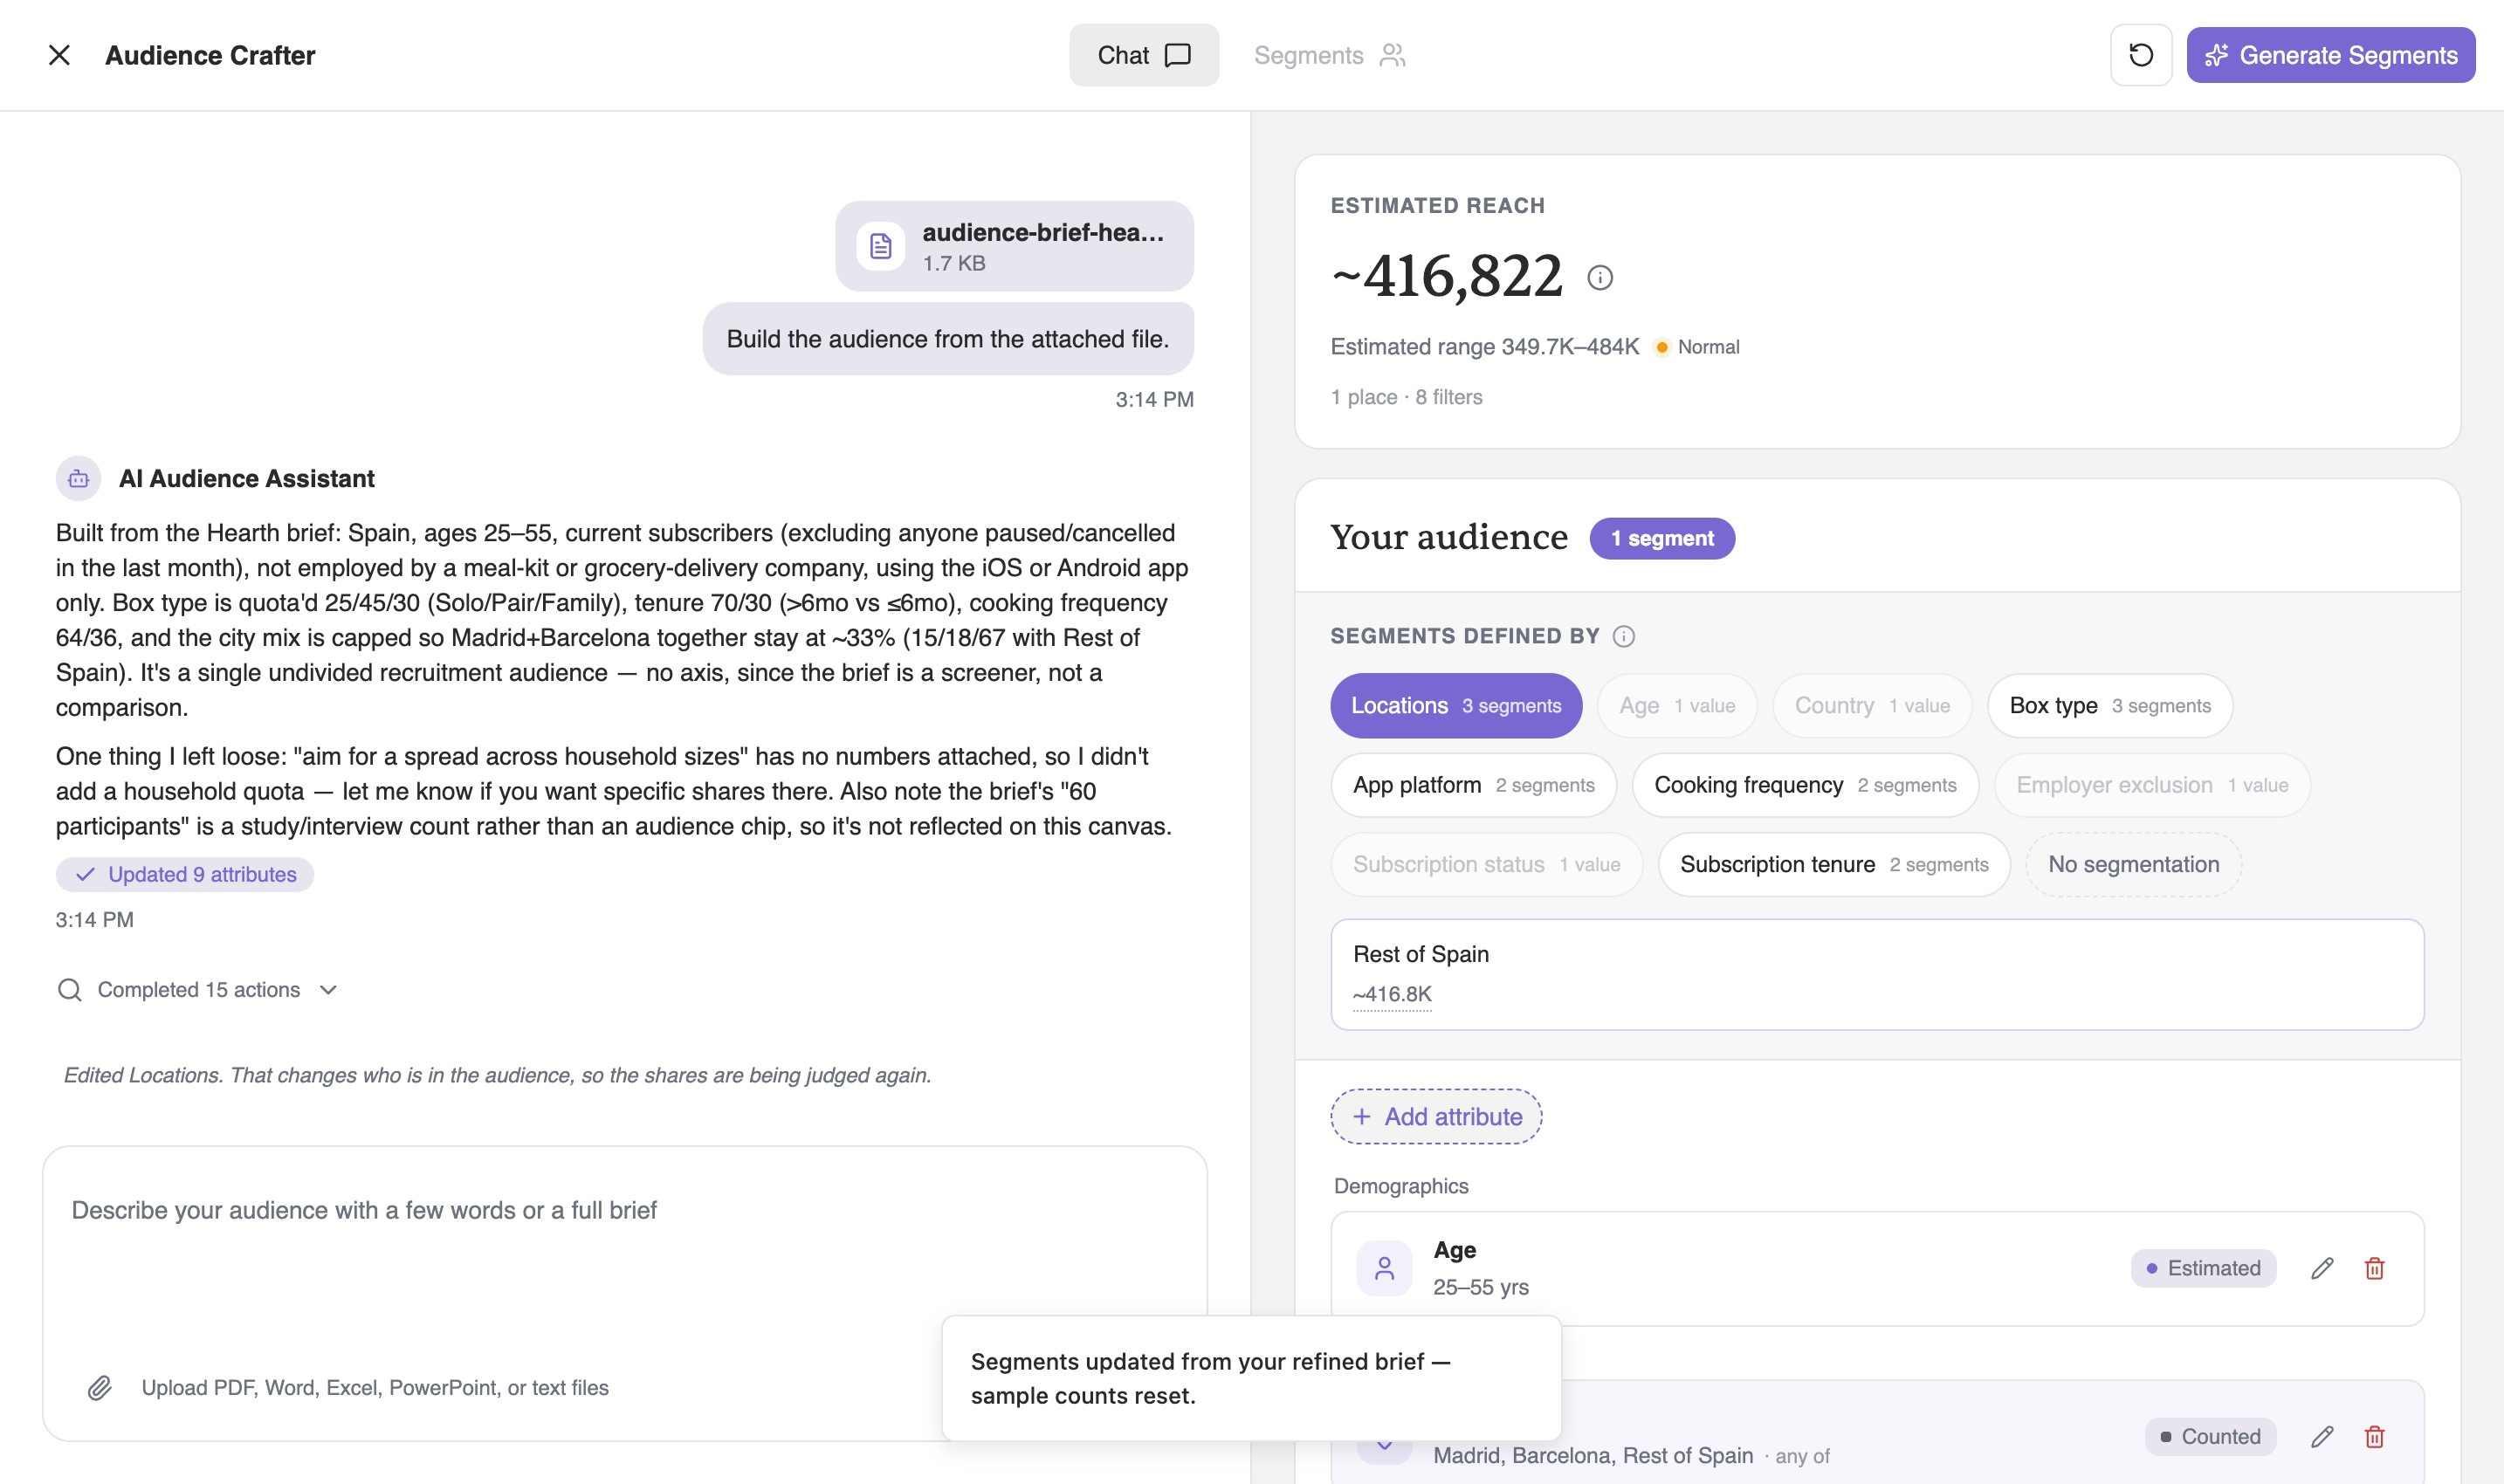
Changing the split changes what a "segment" means, so the sample counts you'd set reset and the shares are judged again. The Crafter says so rather than letting you notice later.
Step 5
Edit anything by hand, starting with age
Every chip the conversation created is an ordinary chip. Open Age and you get the range itself, draggable at either end, and underneath it the part that's new: the distribution.
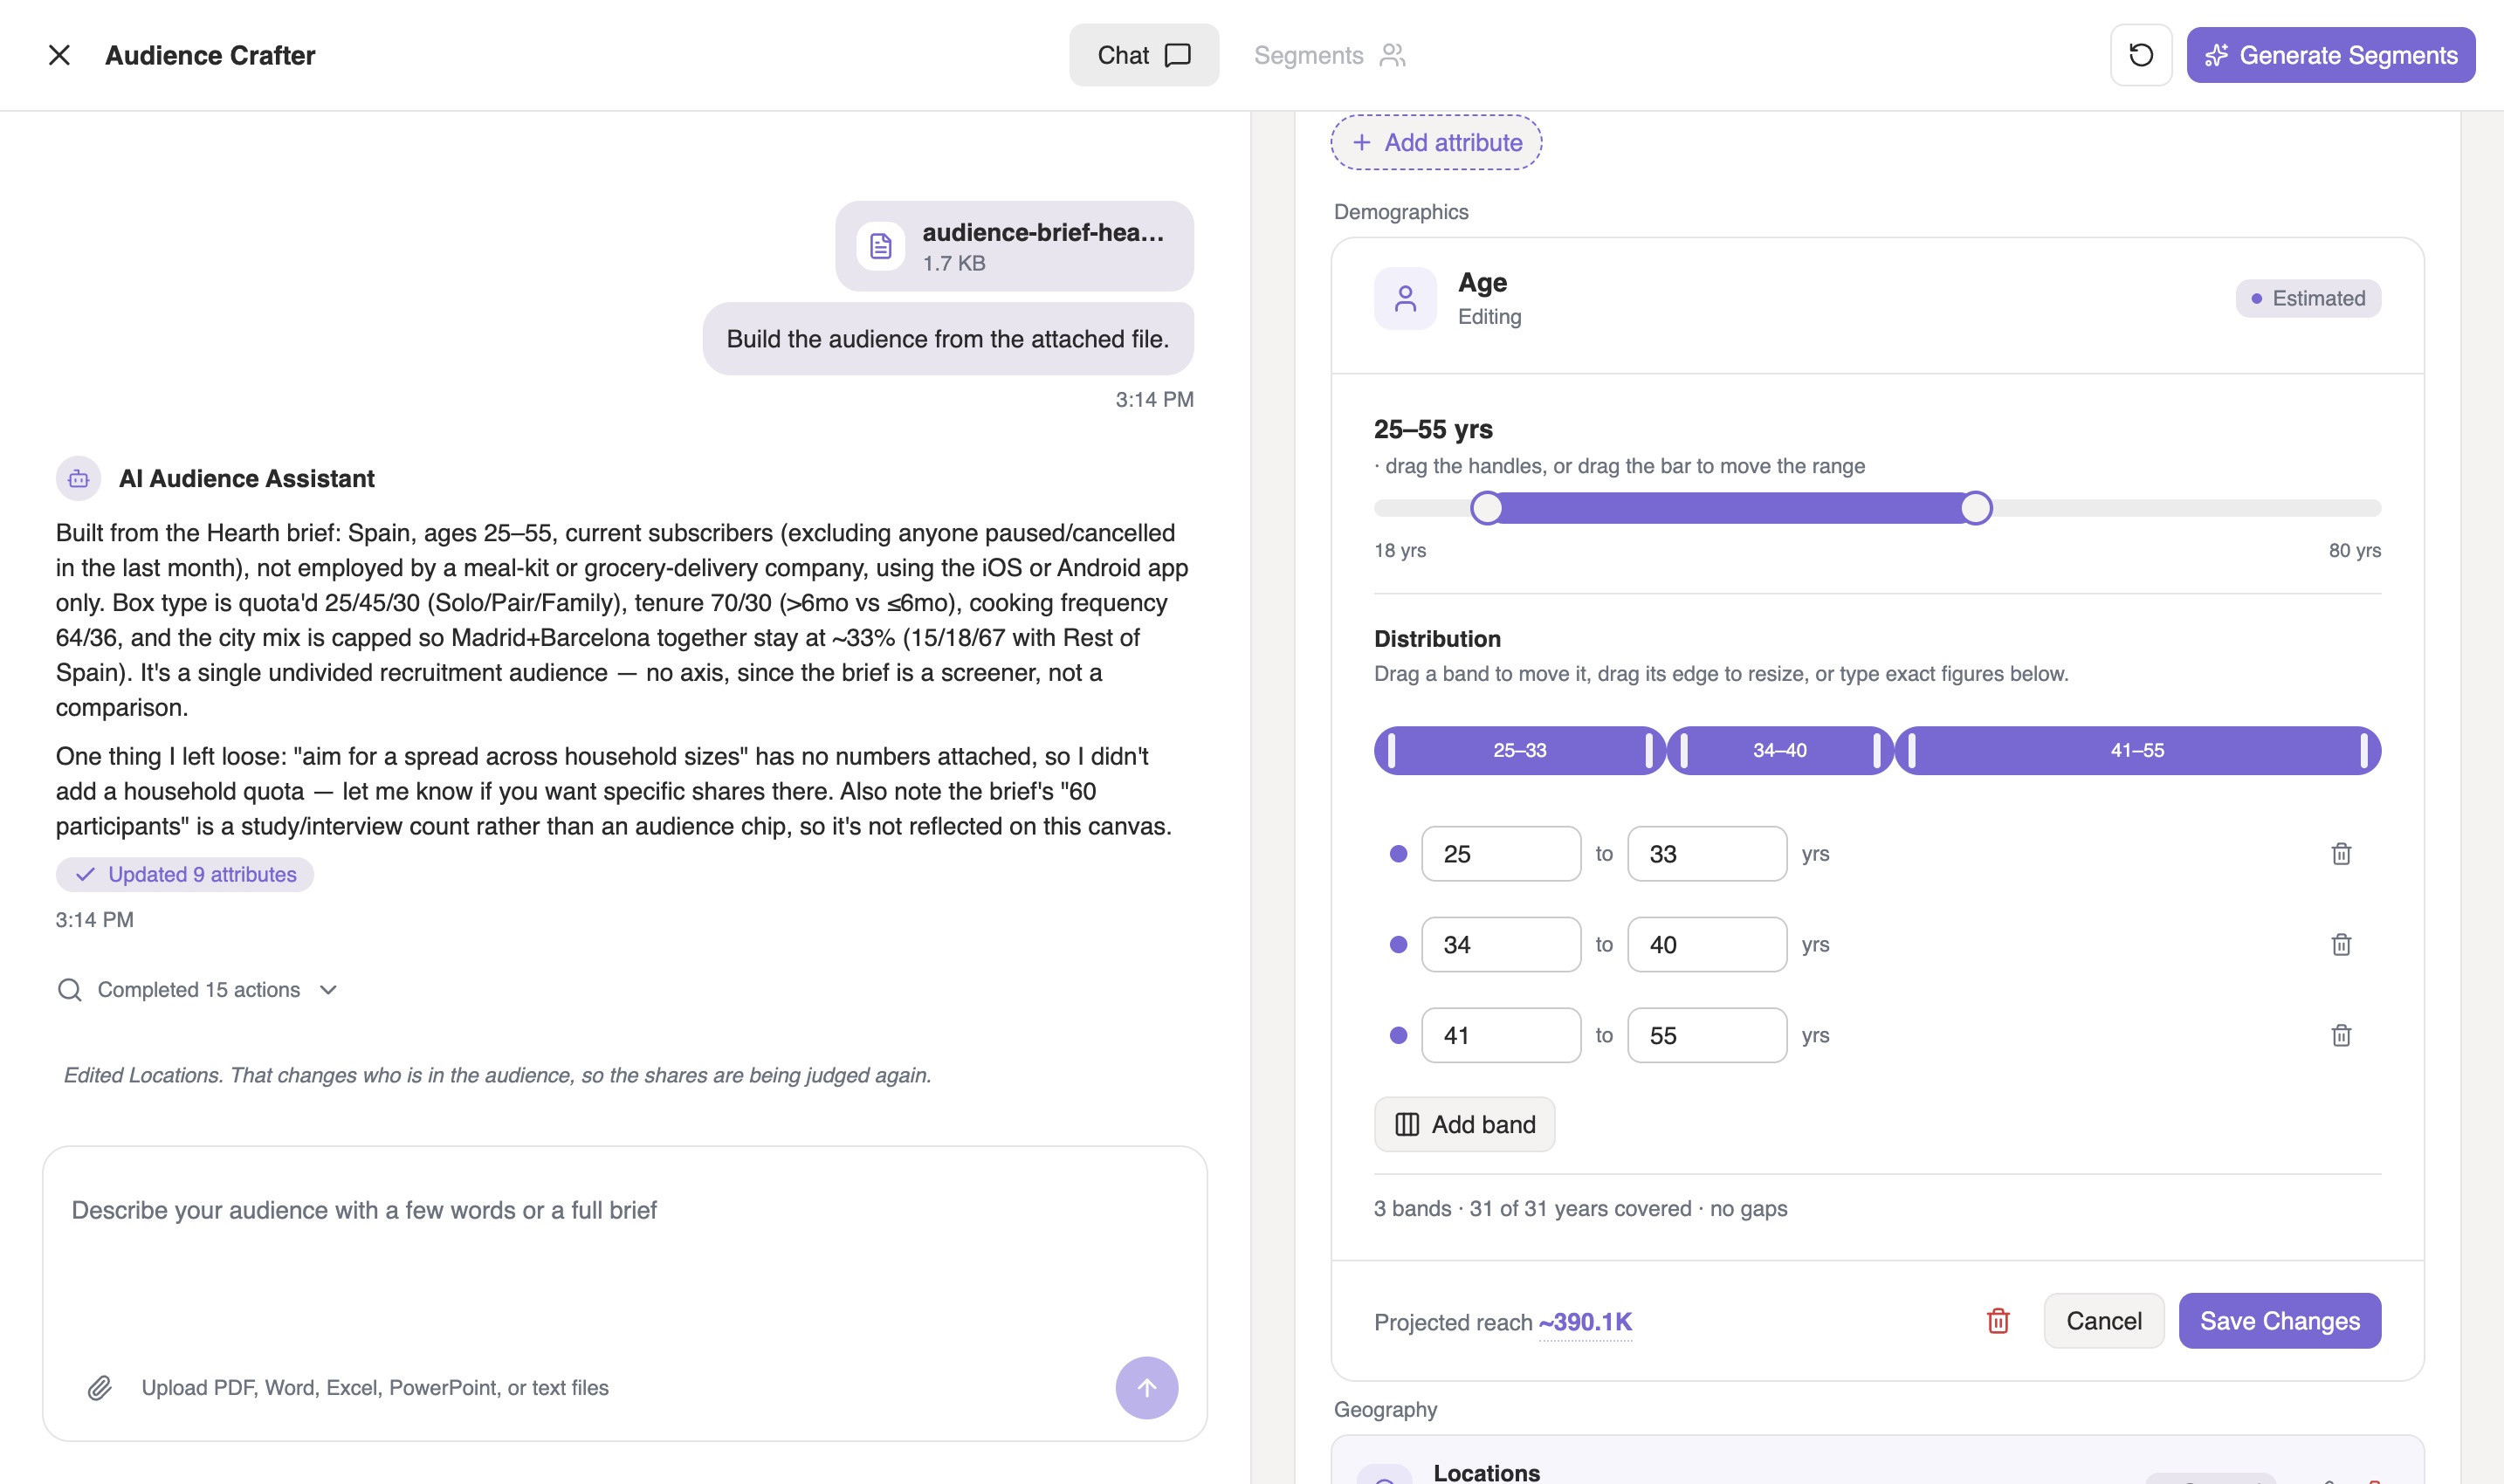
Ask for people aged 25 to 55 and you get one group. Often that isn't what you're after: you want to compare the under-35s with the over-45s and ignore the middle entirely. So the bands are yours to draw, and they don't have to touch. Leave the middle out. Compare the two ends. Add band divides the widest band rather than tacking another onto the end.
The running line underneath keeps you honest, 3 bands · 31 of 31 years covered · no gaps, and Projected reach shows what saving would do to the total before you commit to it.
Step 6
Add attributes yourself
Add attribute is the manual way onto the canvas, and it works the same whether you started from a brief or from nothing. It opens a searchable list of everything available, grouped by demographics, geography and the rest, with what each one would contribute.
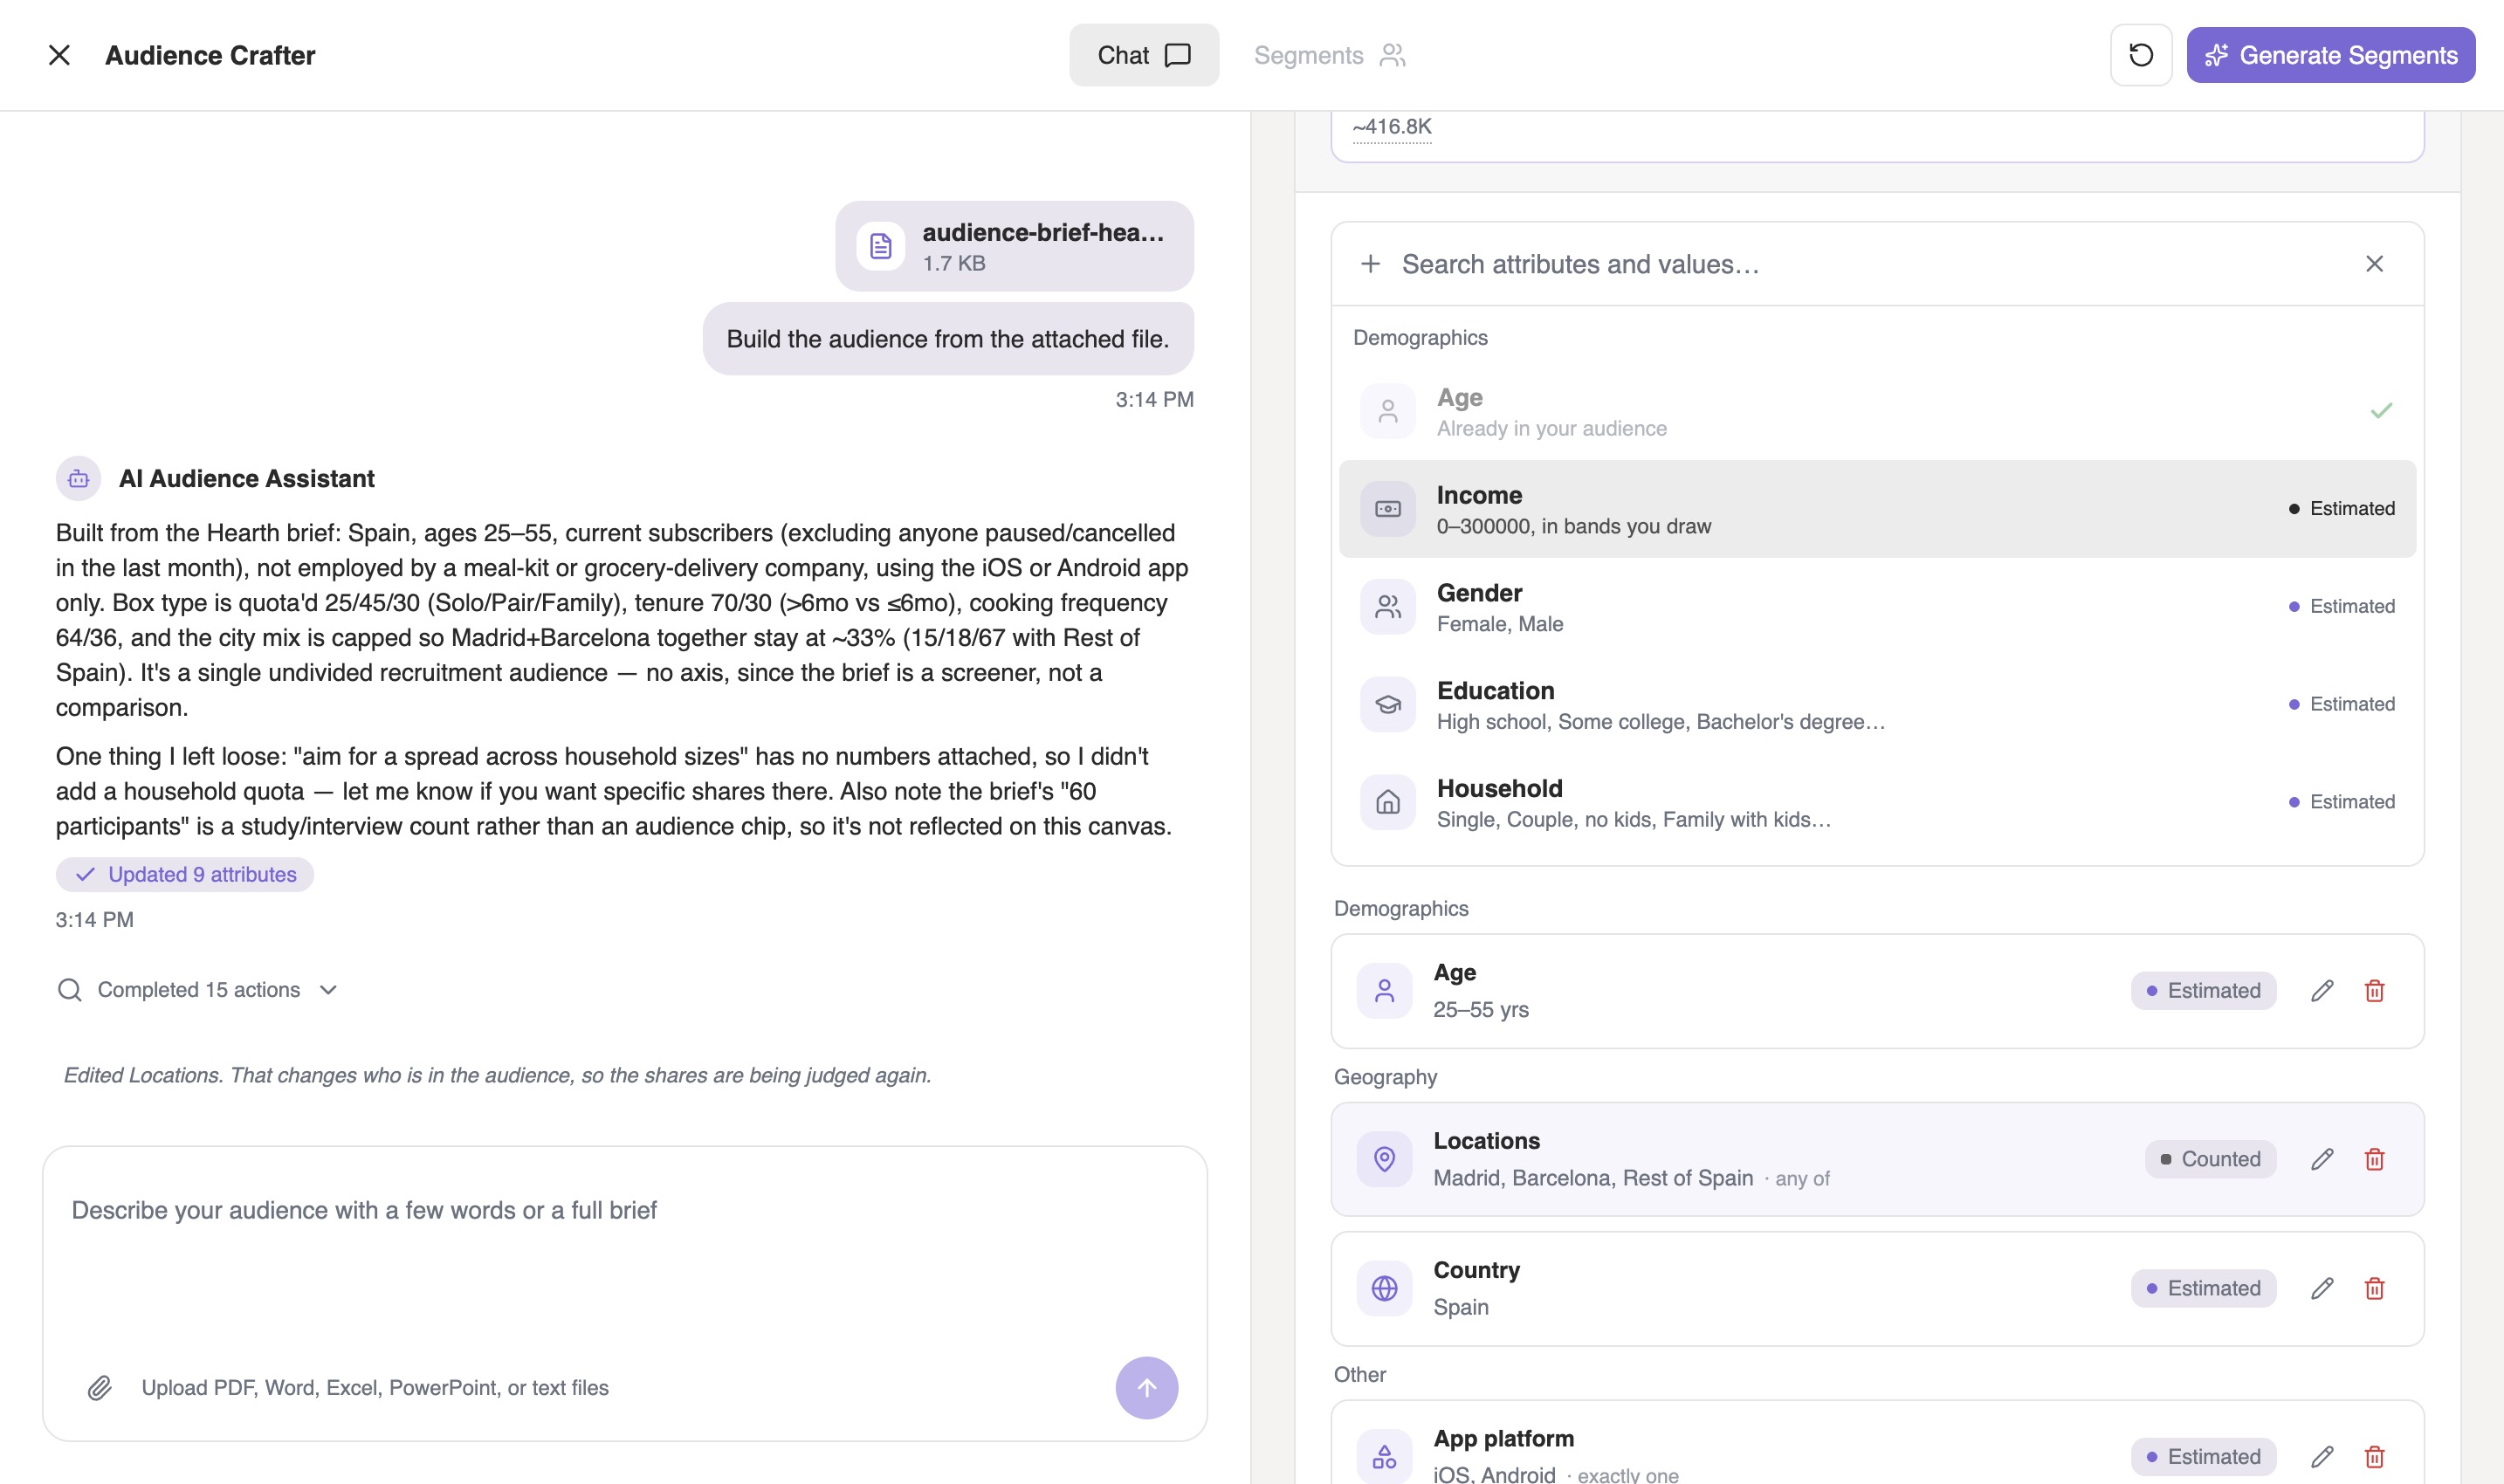
Notice the badge on each chip. Counted means the number under it comes from real population data for the places you picked. Estimated means it's a model's judgement about what share of those people match. Both are used to size the audience; only one of them is a headcount, and the Crafter never blurs the two.
Step 7
Set the values, the rule, and the quota
Open a criterion with several values and you get three separate decisions in one place. Here it's Box type, with Solo, Pair and Family.
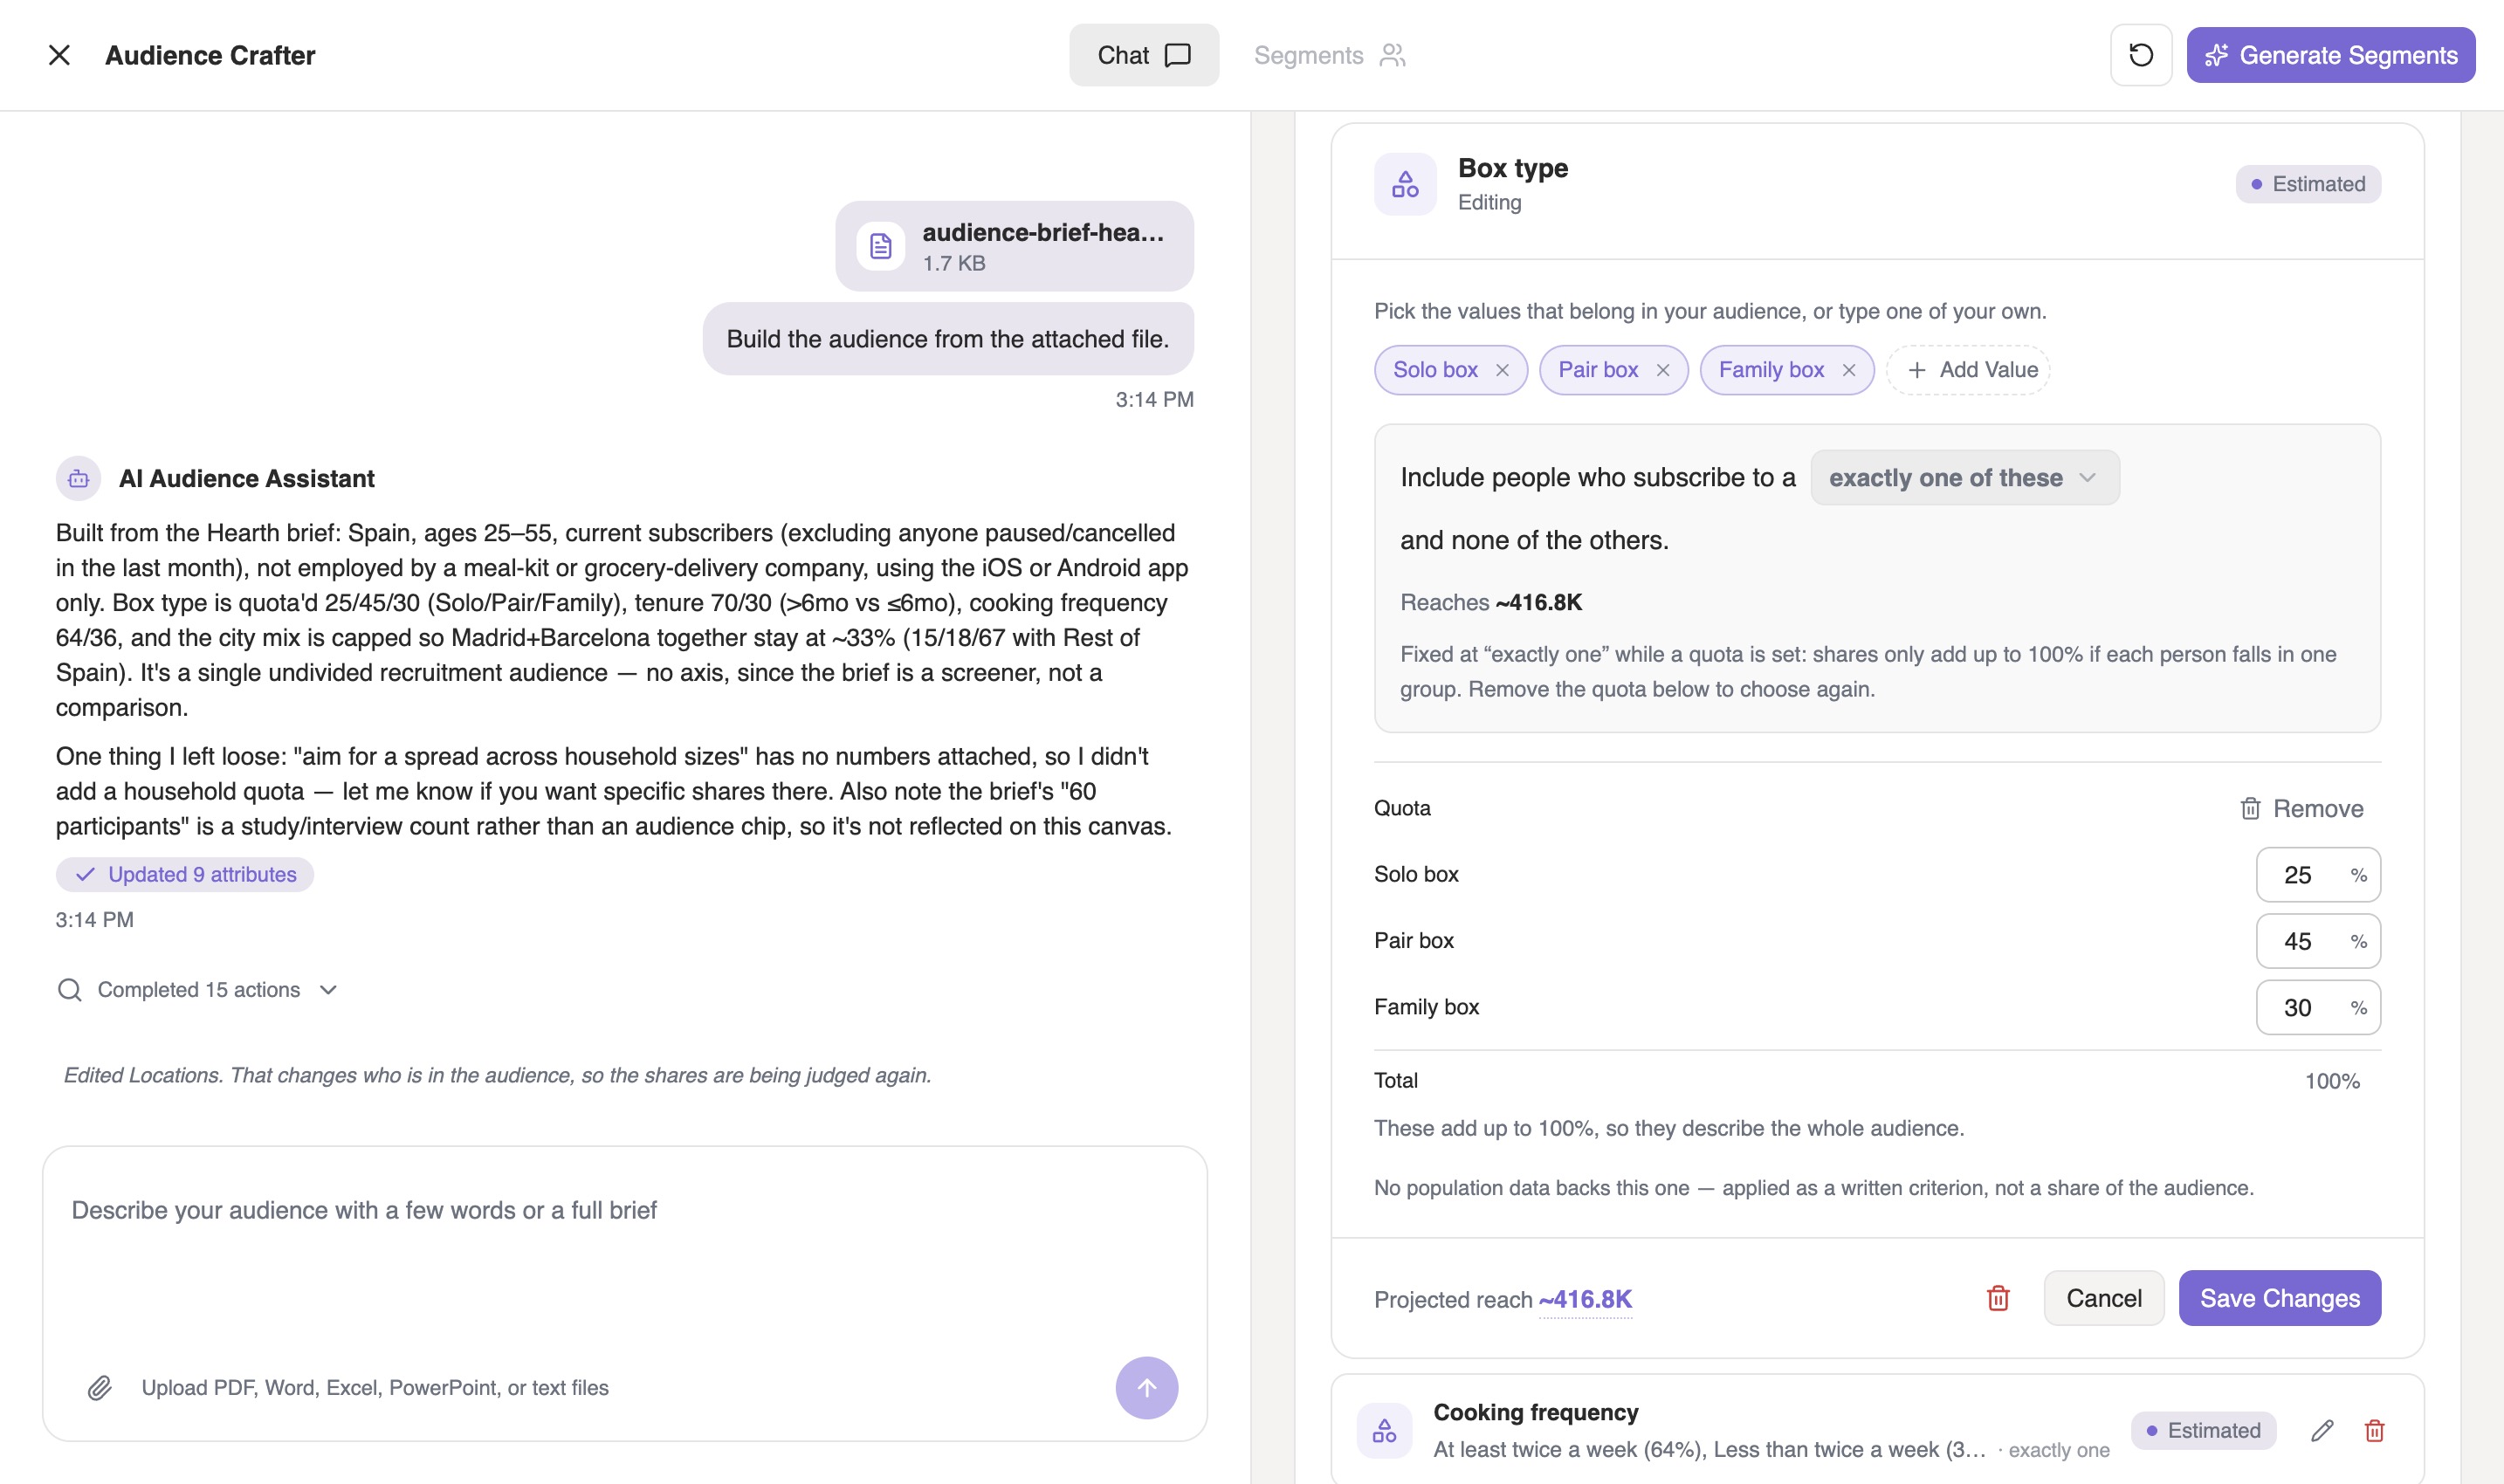
The values
Add one the assistant didn't think of, or type your own. The chat isn't a mode you have to stay inside; it's one of two ways to do the same thing, and neither wins.
The rule
Does your audience subscribe to any of these boxes, exactly one of them, or all three? Those are three genuinely different audiences, and the difference is usually large. That choice used to be made for you, out of sight. It's now a control, with what each option reaches shown next to it.
- It already knows the sane default A subscription tier is exactly one; you aren't on two plans at the same time. Apps, platforms and brands are any of these, because people use several. You only need to touch this when you want something other than the obvious reading.
- It tells you when a rule reaches nobody Ask for all of across three things almost nobody does together and it says Nobody left rather than quietly showing you a very small number, and offers to Switch to Any of.
The quota
A quota is a proportion: 25% Solo, 45% Pair, 30% Family. It divides the audience rather than narrowing it, and the shares add up to everyone. While a quota is set the rule is pinned to exactly one, because shares only total 100% if each person falls in exactly one group. Remove the quota and the rule is yours again.
This one matters more than it looks. Each quota you set is carried into the participants themselves as something that must be true of them, not just into the picture on the canvas. The split you set is the split you get.
A quota needs a group to be a quota of. "70% subscribed over six months" divides whoever your filters have already selected; it doesn't on its own restrict the audience to subscribers at all. If that's what you meant, add a criterion saying so. It's the easiest way to end up with an audience much larger than you intended, and the assistant will tell you when it spots it.
Step 8
Pick your sample, then apply it
The Segments tab is where an audience becomes a set of people to interview. Your segments are on the left with their sizes and their share of the reach; the sample you're allocating across them is the number at the top.
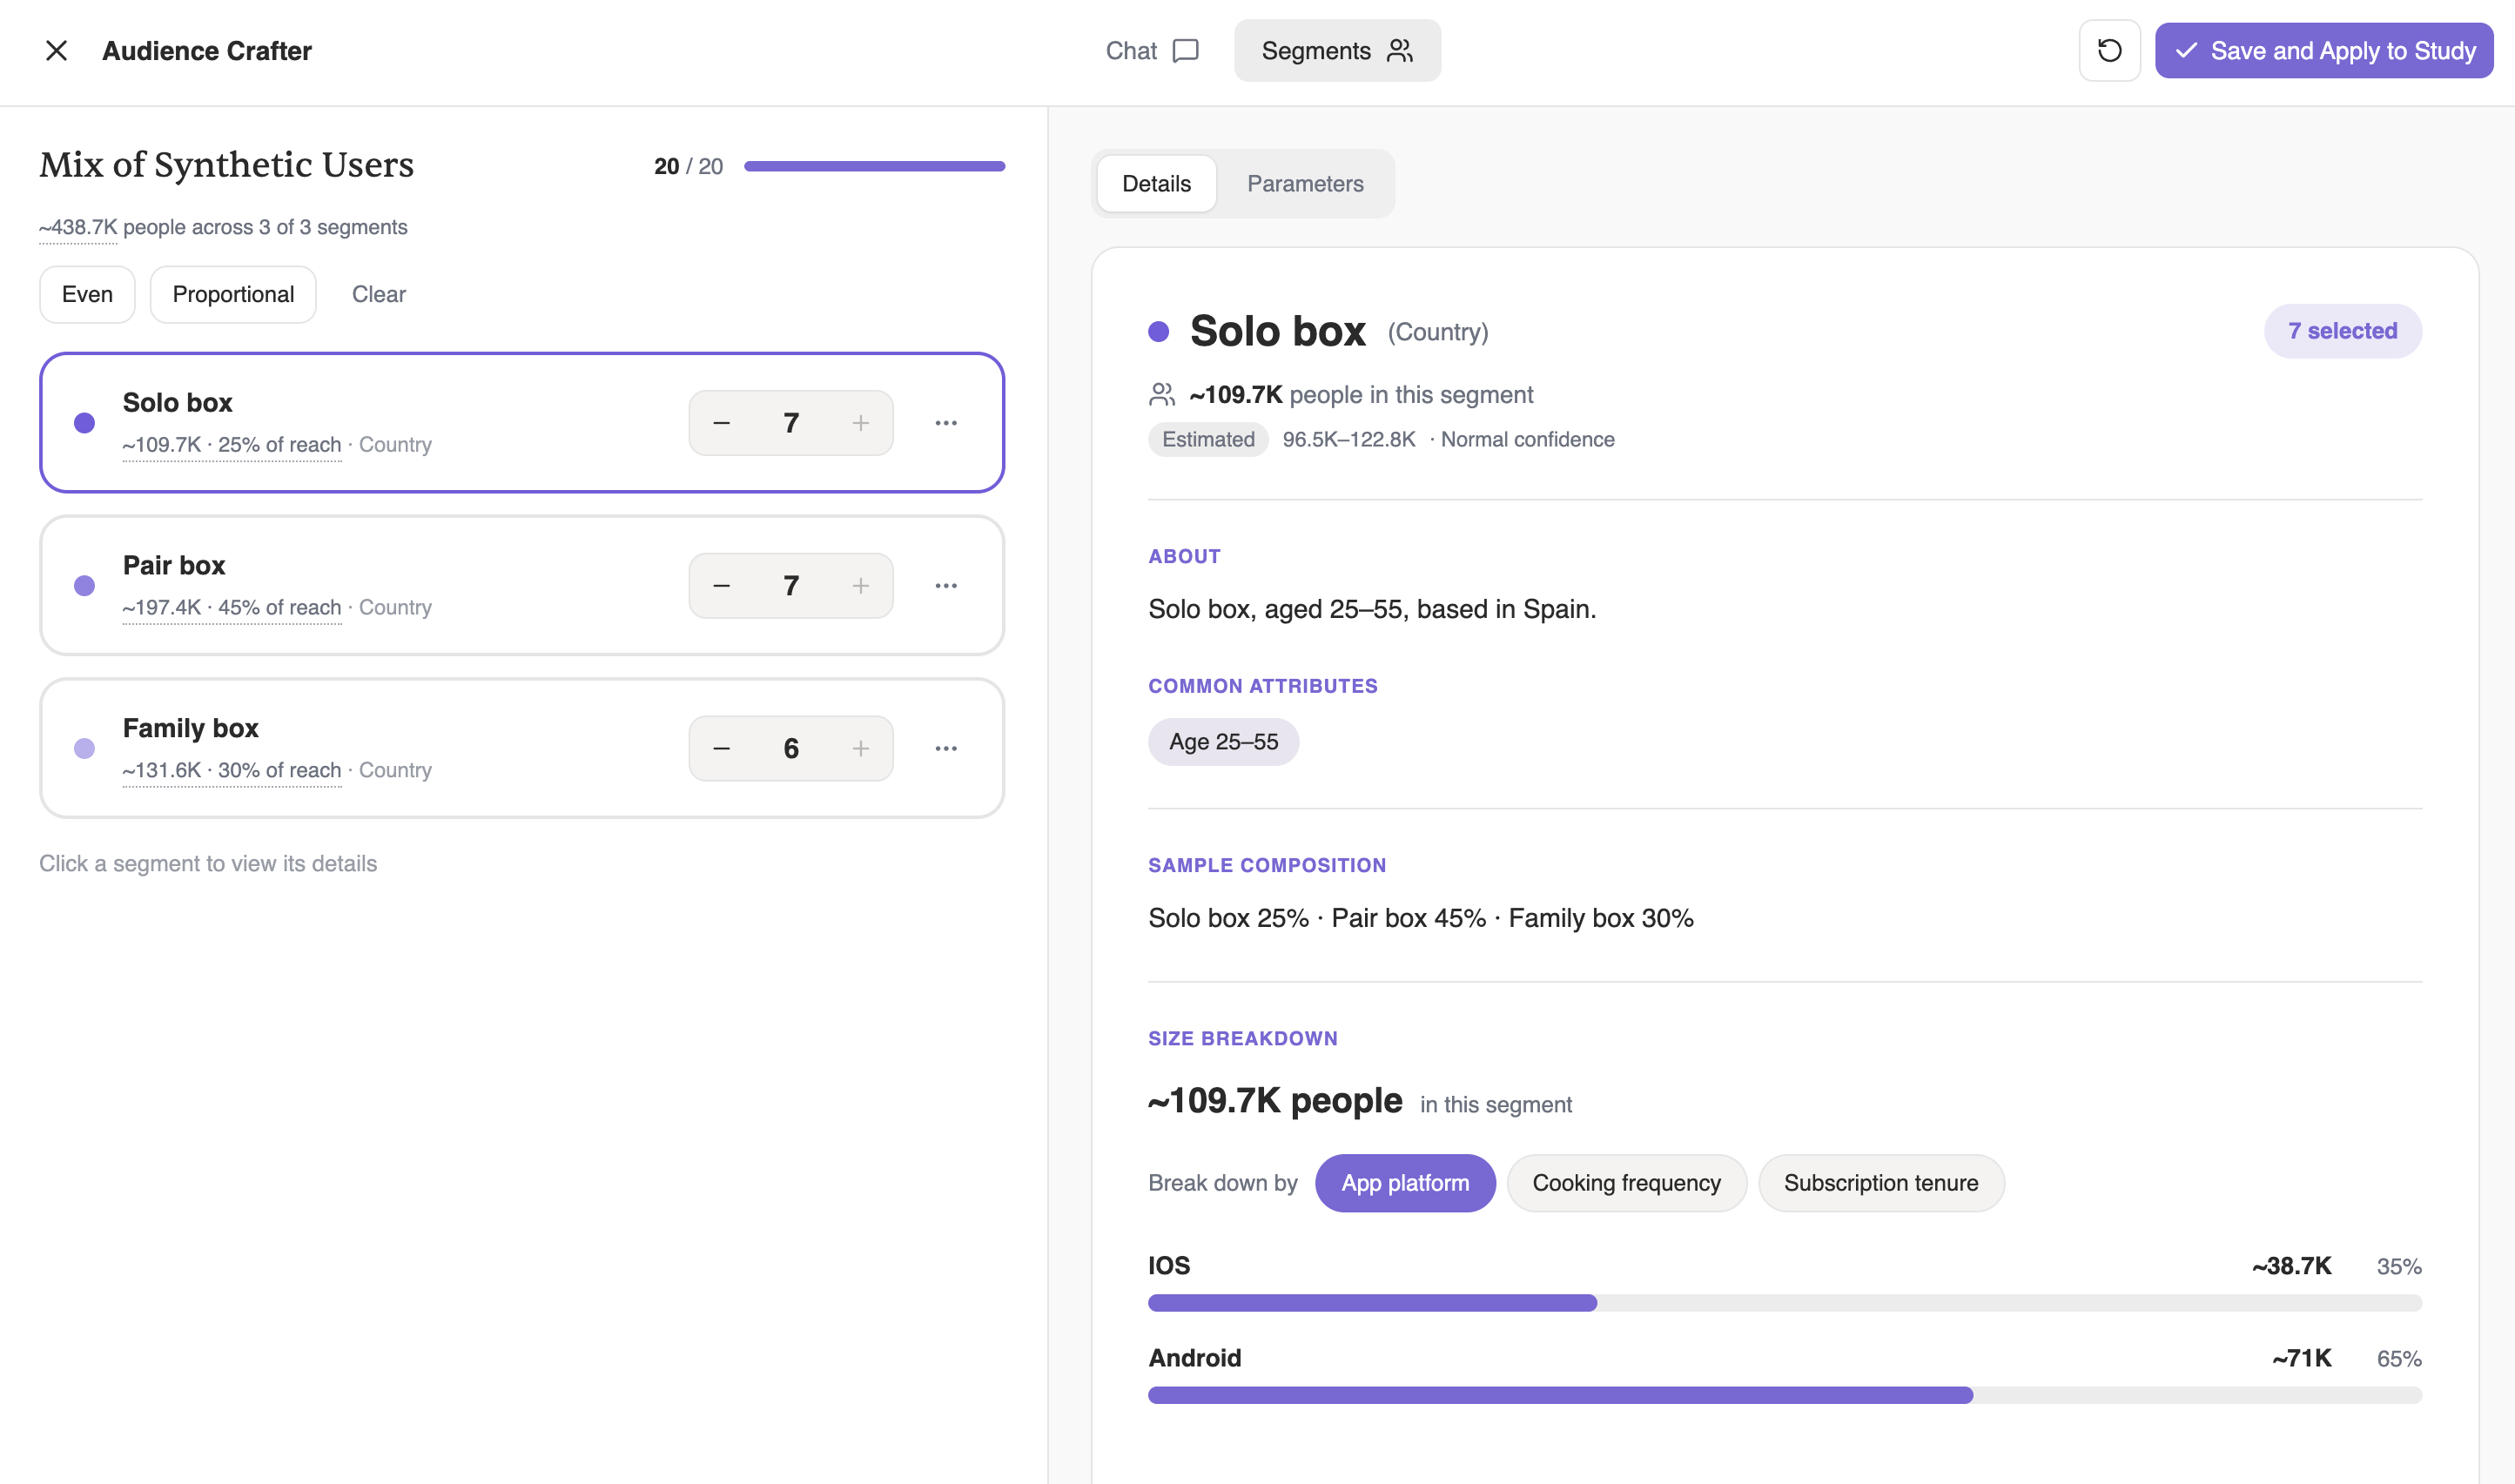
Click a segment and you get its detail: a one-line description, the attributes everyone in it shares, the sample composition, and a size breakdown you can re-cut by any other attribute on the canvas. Here the ~109.7K people in the Solo box segment come out 35% iOS and 65% Android, which is the kind of thing worth knowing before you interview anyone, not after.
Then Save and Apply to Study, and your study has its audience.
Change the split. Watch the total stay still.
Now the part we're most pleased with, and the one that's hardest to photograph. Segment the audience by city, then by box type, then by platform. Redraw a band. The headline number doesn't move.
The audience is worked out once, and every view after that is arithmetic over that single answer. Splitting it a different way asks a different question of the same result rather than starting again, which is also why it's instant.
Cut the audience however you like. The total is the total, and the parts always add up to it.
- The segments add up to exactly the headline Not approximately. The rounding is done so the parts sum to the whole you were already shown.
- You can check the working Every size has an Open the maths link, How we estimated this, showing what each criterion did to the number, in order, including any line that narrowed nothing.
How it works, briefly
For the curious. It starts with a real headcount: actual population data for the places you picked, not an estimate of one. That figure is the floor everything else stands on.
On top of it, we ask the model once for a picture of how that population divides at each of your criteria, and then every view you ask for is ordinary arithmetic over that one picture. That's why switching views is instant, why the parts sum to the whole, and why the figure holds still. And because that picture is a model's judgement rather than a headcount, we ask for it more than once and keep the middle answer rather than trusting a single reply.
What the numbers are, and what they aren't
Worth being precise, because it's an easy thing to assume.
The percentages the Audience Crafter estimates, what share of your audience does this or owns that, are there to size the audience and show you its shape. They're an informed estimate, and they're what the size on screen is built from.
Your quotas are different. Those are instructions, and they're carried into the participants themselves. Same for your criteria and your segments. You'll also see the Crafter say so directly when a criterion has no population data behind it: applied as a written criterion, not as a share of the audience.
Eight steps, and you have a complete audience: a brief you didn't have to retype, criteria you can open and change, a split you chose rather than inherited, and twenty participants allocated across it. Save and Apply to Study hands it to the study, and it stays in My saved audiences for the next piece of research that needs the same people.
The Audience Crafter is available in every study today. Open one, give it the brief you already have, and see who's out there.