
Tutorials
User testing, rebuilt: websites, phones and native apps
Synthetic Users now test your app on real phones and tablets, and every study ends in a screen map of where people clicked, looked and got stuck.
What changed
User testing on Synthetic Users has had its biggest update yet. You can now test a native Android or iOS app on real devices, not just a website. Every session explains itself: how it ended, how hard it felt, and where the participant explored, got stuck or found their way. And the Summary turns all of those sessions into one screen map per task.
The screenshots follow a made-up coffee roaster, Fernhill, testing how people find a coffee subscription on its site.
Test any website, on any screen
Point a study at a live site or a prototype link, and each Synthetic User opens it in a real browser and works through your tasks in order.
- Laptop, tablet or phone. Phone and tablet studies use touch, so a tap behaves the way it does on a real device.
- A start URL per task. From the second task on, a task can begin on its own page instead of wherever the last one ended. Start URLs are checked before the study runs.
- Sites behind a sign-in. Give the study a login and participants start signed in.
- Better tasks before you run. Task review reads each task as you write it and suggests how to make it clearer.
Native apps, on real devices
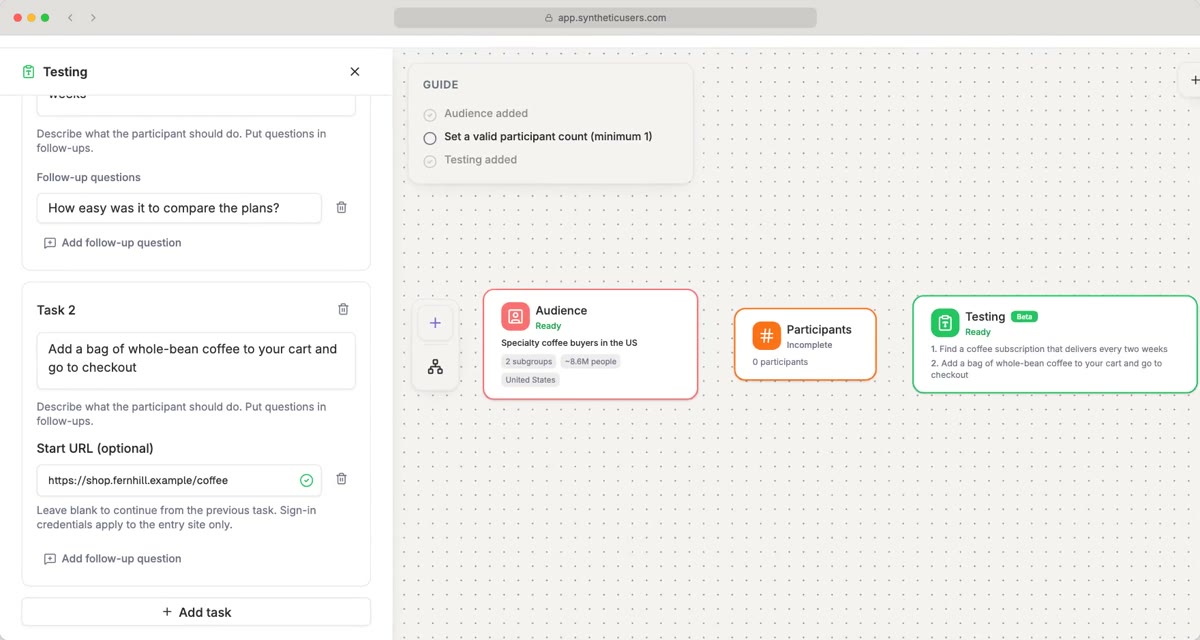
- Create a study from the User testing template and open Testing.
- Open the Mobile App tab and upload your build: an APK for Android, or an IPA for iOS.
- Choose Phone or Tablet, and Portrait or Landscape.
- Write your tasks. They run in order on the same device, as someone would use your app in one sitting.
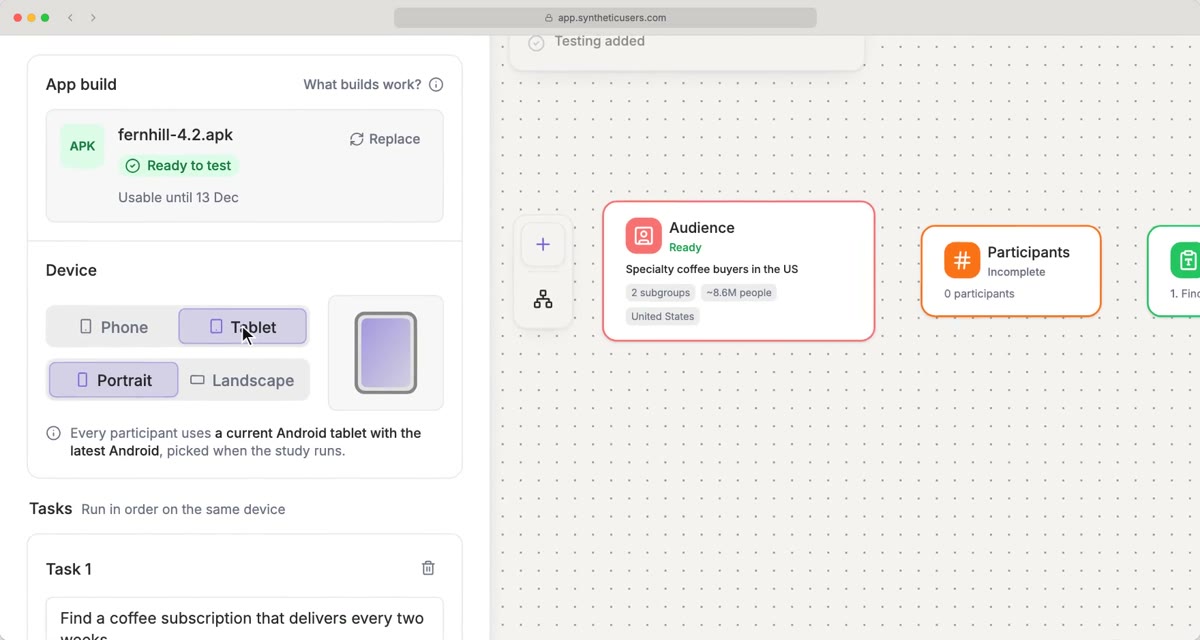
Every participant gets the same current device model with the latest OS, picked when the study runs, so their screens line up when you compare them. When a session ends, its recording starts the moment the participant first looks at your app, not while the phone was being set up, and each tap is placed on the video.
Every session explains itself
Open any participant to watch their session. Each click or tap comes with what they were thinking at that moment, and above the recording you see how the task went.
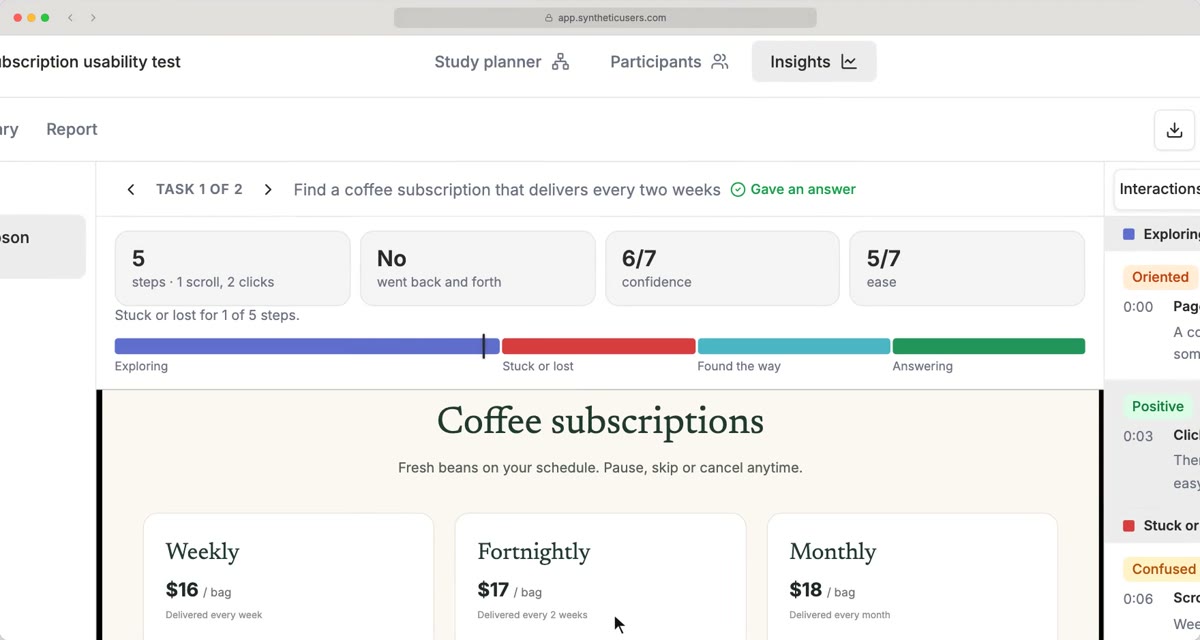
- How it ended: Gave an answer or Gave up.
- The numbers: steps (with scrolls and clicks or taps), whether they went back and forth, and their own ratings of confidence and ease, from 1 to 7.
- The phases: where they were Exploring, Stuck or lost, Found the way and Answering.
Follow-up questions work as before: ask every participant, or just one, what they thought after each task.
The Summary: one screen map per task
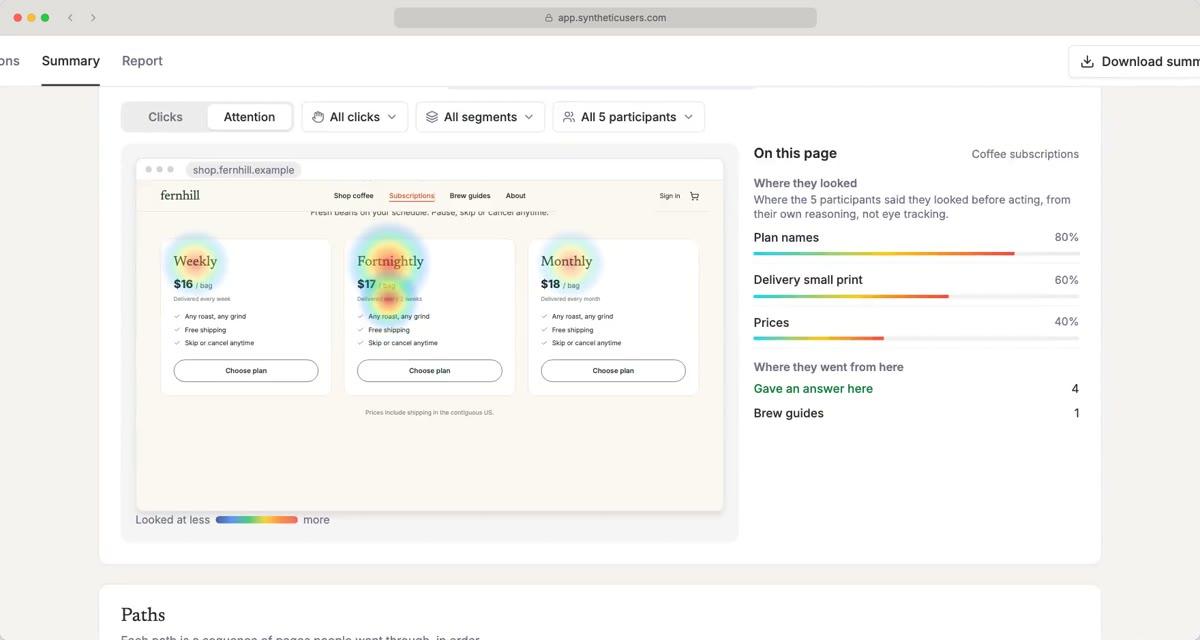
The Summary pulls every session together, task by task. Each task shows how many people gave an answer, flags the hardest one, and lists how many went back and forth, the most clicked (or tapped) element, the average steps, and the average confidence and ease.
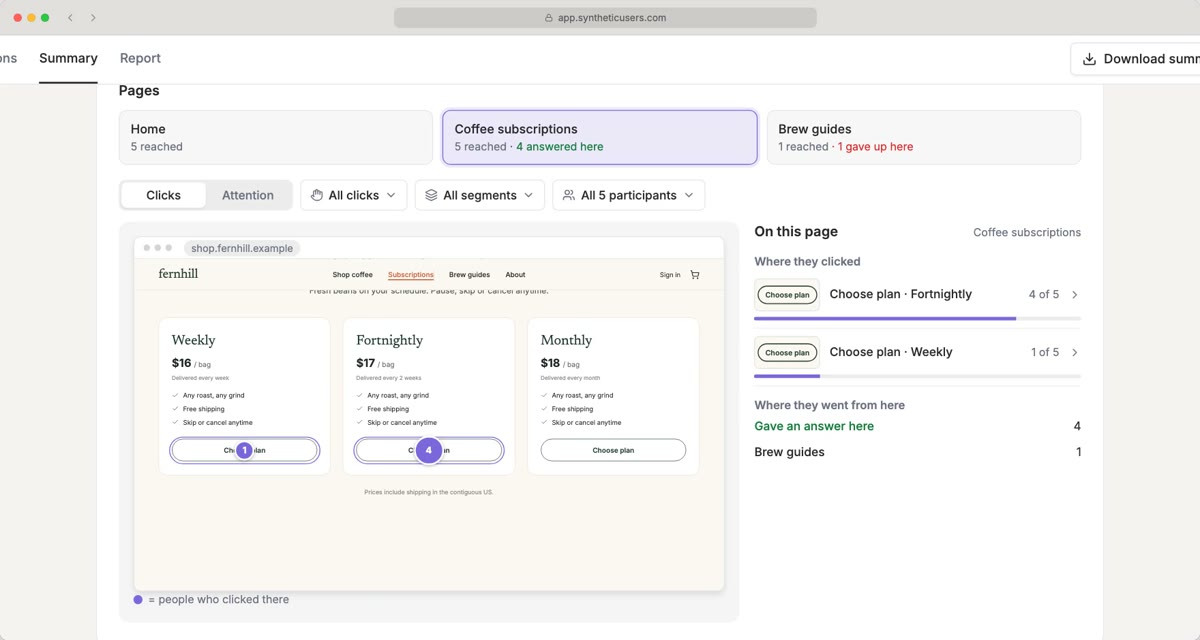
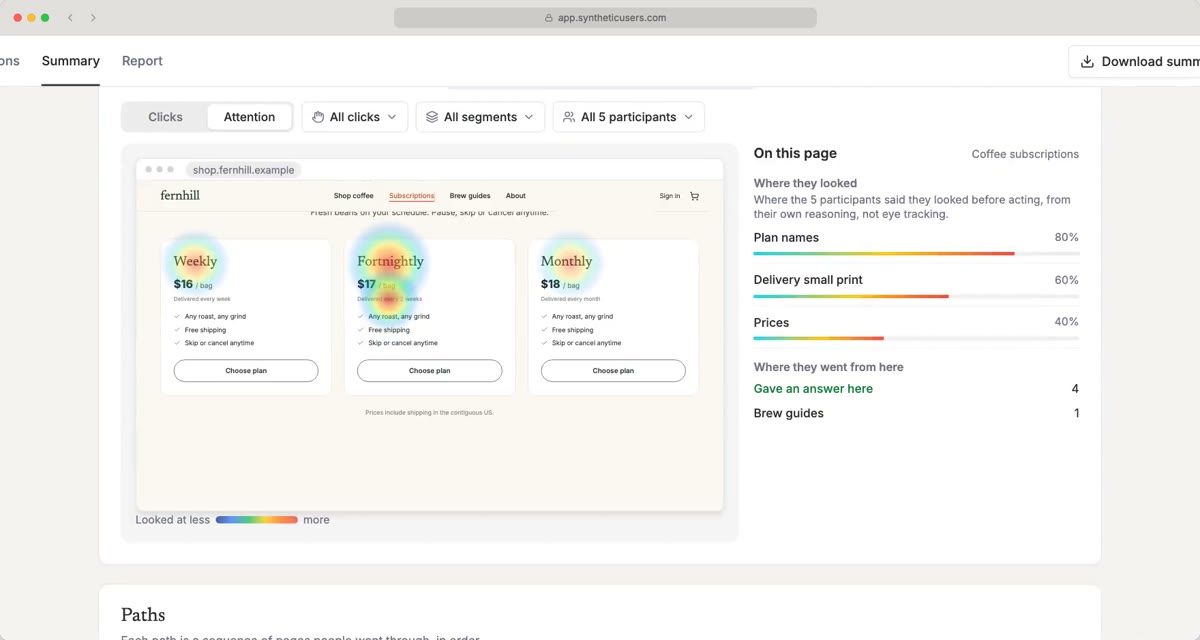
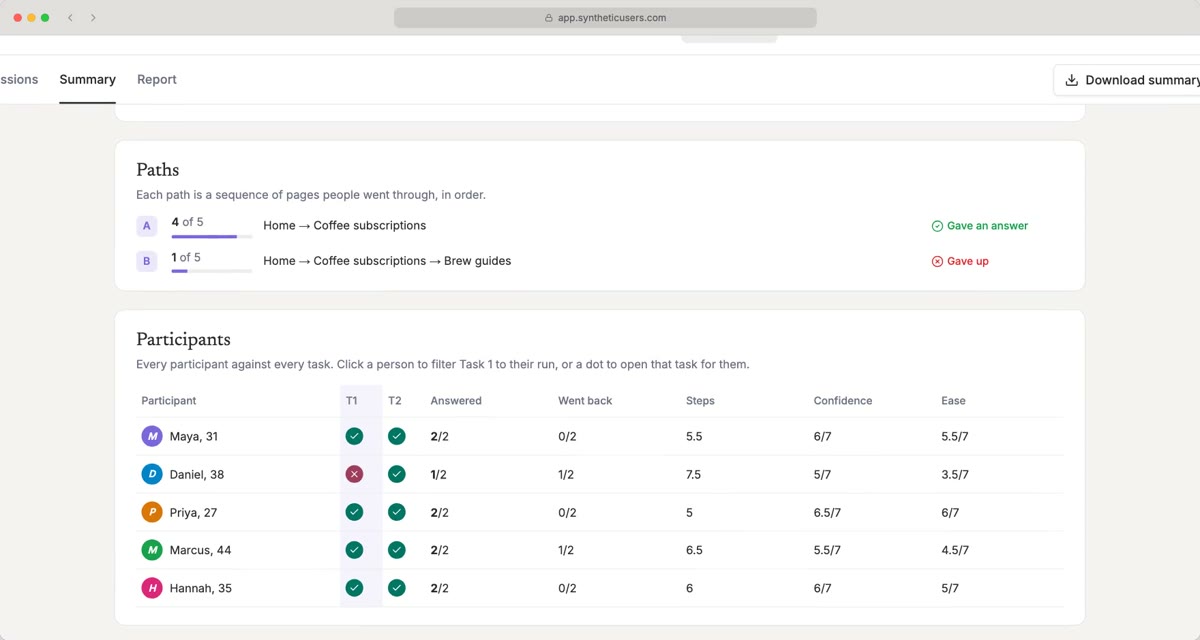
Filter the whole map to one segment or one person, and jump from any quote to that moment in the recording. App studies get the same Summary: screens are named by what they are (Cart, Search results, Listing details), and identical screens are matched across participants even when they reached them by different routes.
Watch it in two and a half minutes: User Testing | Synthetic Users tutorial.
To try it, create a study from the User testing template, then add an entry URL, or open Mobile App and upload your build.
All data in the screenshots is fictional.