
Science
Where do synthetic eyes look?
Every Synthetic User in your concept tests and user tests now shows you where their attention lands, on the package, the price, the headline, the button, conditioned on who they are and what they told you. Validated against thousands of images of real human eye-tracking. Nobody else does this.
Eye tracking has always been the evidence user researchers want and almost never get. A lab, a tracker, weeks of recruitment, a few dozen participants, for one study. Most teams settle for the next best thing: predictive attention tools that render a single heatmap of where "the average viewer" would look.
Here's the problem with that heatmap: there is no average viewer in your target market. There's Rosa, who reads the price before anything else. There's Denis, who goes straight for the spec table and distrusts every adjective. A map of the average of them describes neither of them, and it can't tell you why either one bounced.
We built the thing researchers actually wanted. Every synthetic participant, with their own identity, their own priorities, their own interview, now produces their own predicted-attention map, on the exact image they reacted to. When a participant tells you the price felt buried, you can now see the pass their attention made to find it. In user-testing studies the same evidence follows participants across every screen of a task, that gets its own section below.
How it works
Human attention is two forces at once. There are the reflexes every one of us shares, eyes snap to faces, to contrast, to bold text, before we've decided anything. And there is intent, which is yours alone: the price-checker's beeline, the engineer's drift to the spec table. Model only the first and you get the same map for everyone. Model only the second and you get a participant who is somehow blind to a face in the hero shot. We model both, separately, and blend them.
A saliency model, trained on thousands of real gaze recordings, supplies the shared layer, where any human's eye gets pulled on this exact image. A persona model supplies the individual layer, where this participant looks, predicted from who they are and what they said in their own interview. The final map is mostly persona, seasoned with shared reflex, a ratio we tuned so that accuracy improves while participants stay measurably distinct from one another.
their interview
where they look
what pulls every eye
attention heatmap
Validated against real eyes
A predicted heatmap is a claim, and we don't ship claims unmeasured. Before release, we graded these maps against close to three thousand images of recorded human gaze real people, real eye trackers, spanning the same mix our customers test: product imagery and claim text first, then advertisements, interfaces and marketing pages. Multiple metrics at once, so no single flattering number could carry the verdict. The maps scored strongest exactly where concept testing lives: product and advertising content.

78% of a person, and why that's the number to beat
Here's the comparison most attention tools hope you never ask about. "Ground truth" in eye tracking is a crowd, the reference map for each image pools the gaze of ten to twenty-five people. So before scoring ourselves, we asked the harder question: how well does one real human match that crowd? We took each tracked participant's single pass and scored it against the pooled gaze of everyone else, the same way we score our own maps.
The answer reframes everything: real individuals agree with their own crowd far less than "ground truth" implies, and on product content, least of all. People are idiosyncratic. That's why research has participants instead of an average.
Measured against that human ceiling, our per-participant maps score at 78% of a real participant's own consistency with the crowd on interfaces and on product content. Here is what that number actually buys you, because the comparison is lopsided in a way that favors the synthetic participant. A real person in a three-second exposure gives you about eight glances, a sparse, one-shot trace of where one individual happened to look, that one time. Our map is dense. It renders the full attention profile of a person with those characteristics, not just the eight places one Rosa looked on one Tuesday, but what someone like Rosa also looks at: the discount badge she'd catch on a second pass, the fine print she'd drift to, the product shot that holds her. At 78% of the ceiling, we're approaching the agreement limit that separates any two real humans, while showing you more per participant than any single human pass ever could.
Attention that knows who's looking
The claim that makes this different from every predictive-attention tool on the market is the persona, so we attacked it. We generated pairs of completely independent interviews for the same participants and checked, adversarially, whether a participant's two attention maps agree with each other more than with anyone else's. Pass criteria written down before running. The result was decisive: identity survives. Not just "a bargain hunter looks different from a luxury buyer" two different bargain hunters stay distinguishable from each other, across interviews that share no words.
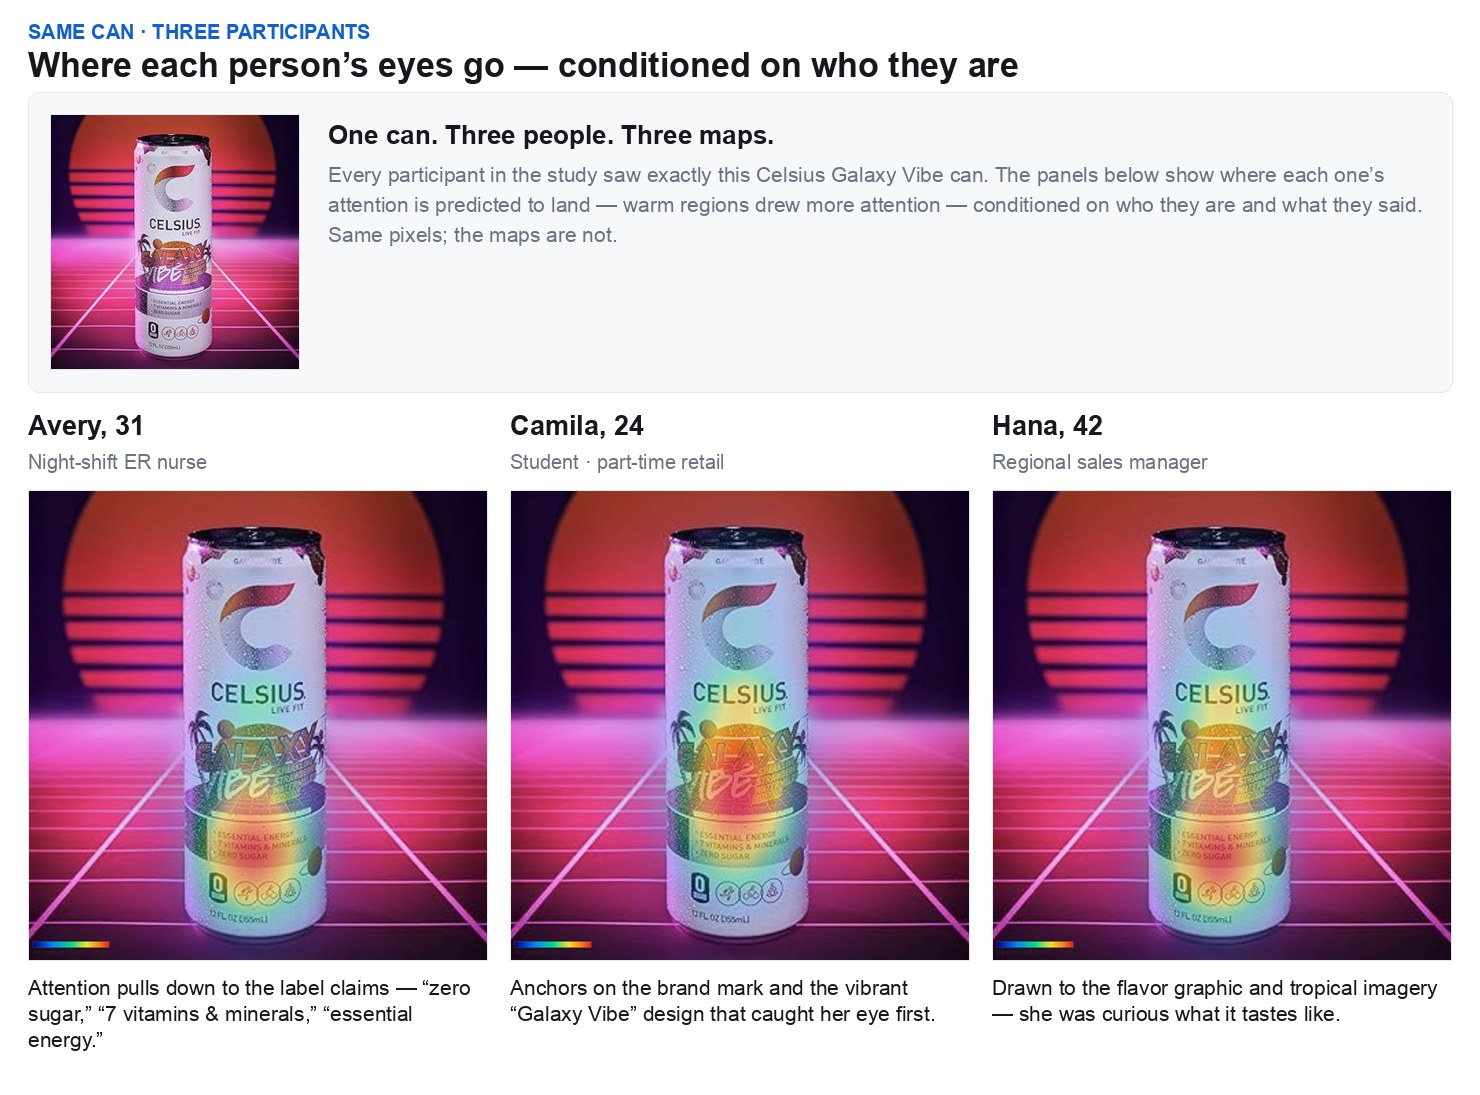
You can watch it happen. We showed the same Celsius Galaxy Vibe energy-drink can to three participants in one packaging study, and their attention split along who they are. Avery, a night-shift ER nurse, was the only one whose gaze traveled down the can to the functional claims, "zero sugar," "7 vitamins & minerals," "essential energy", the fine print she screens every drink against before a shift. Camila, a student, never left the brand mark and the vibrant "Galaxy Vibe" design that caught her first. Hana, in sales, settled on the flavor graphic, she just wanted to know what it tastes like. Same pixels, three people, three maps, and every map comes attached to the participant's own words explaining it. No population heatmap, at any accuracy, can tell you that the zero-sugar claim landed for the exact segment you're trying to win.
From concepts to journeys: user testing
A concept test is a portrait, one image, one reaction. User testing is a film. In our user-testing studies, synthetic participants don't look at screenshots of your product; they operate the real thing, in a live browser, chasing a real task: find the plan that fits, work out the shipping cost, try to cancel.
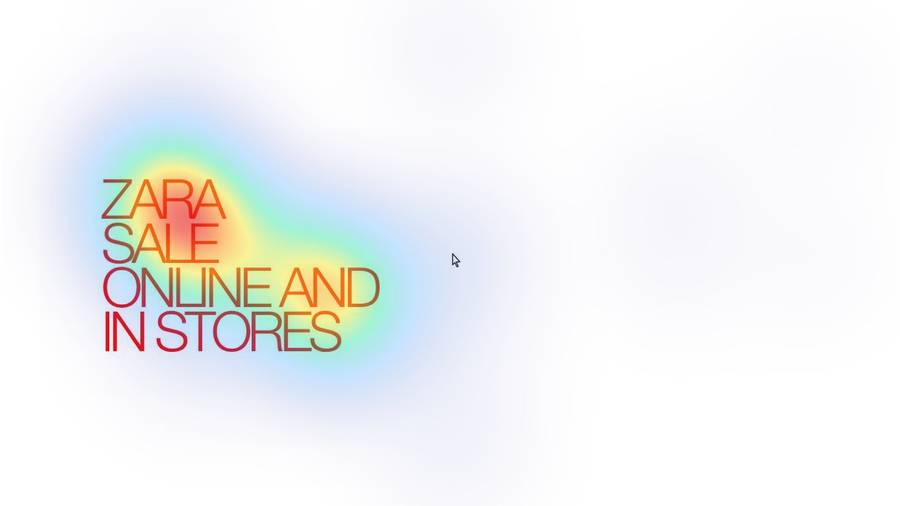
Attention is a journey. For every screen a participant crosses, we predict where their eyes go, driven by who they are, the task they're carrying, what they're thinking at that exact step, and the signal concept tests don't have: their actual behavior on the page, what they inspected, hovered, clicked, and backtracked from. It ships as a gaze storyboard: flip through a participant's screens and watch their attention hunt for the button your design hid, with their spoken reasoning alongside. The closest thing research has ever had to sitting behind the one-way mirror, without booking the room, recruiting the panel, or waiting three weeks.
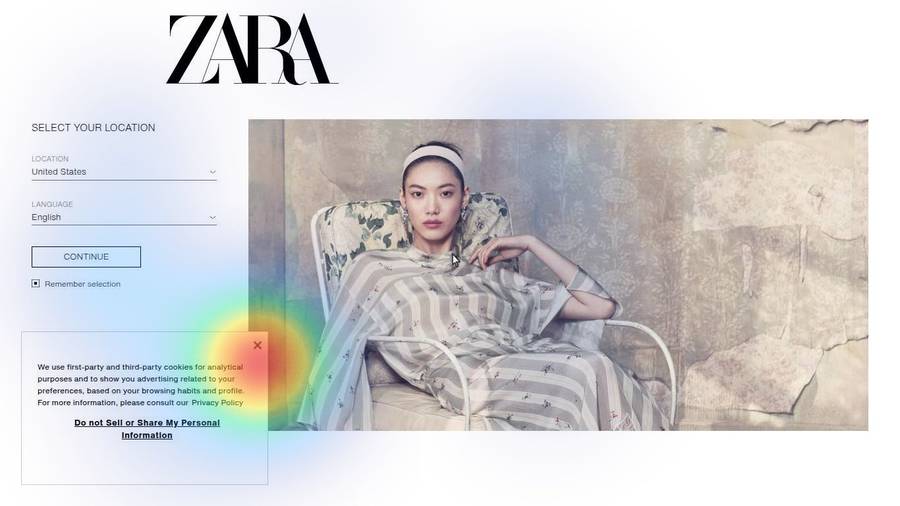
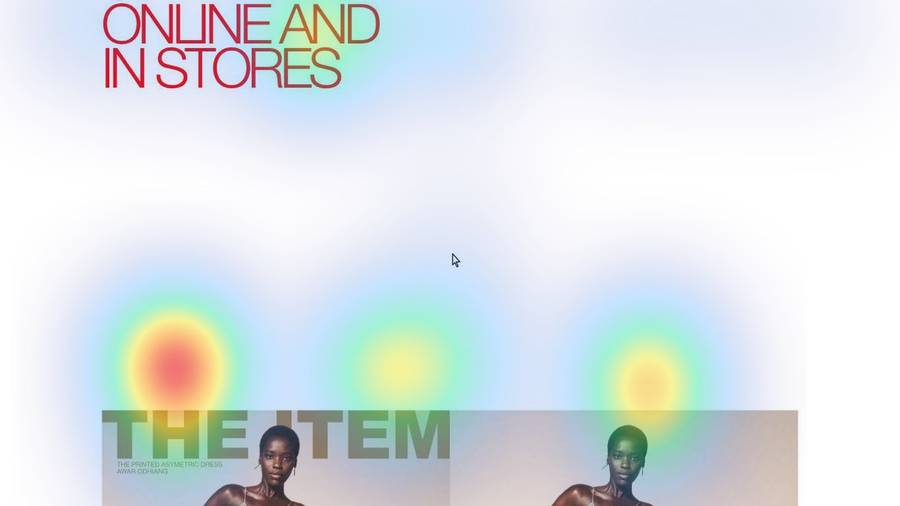
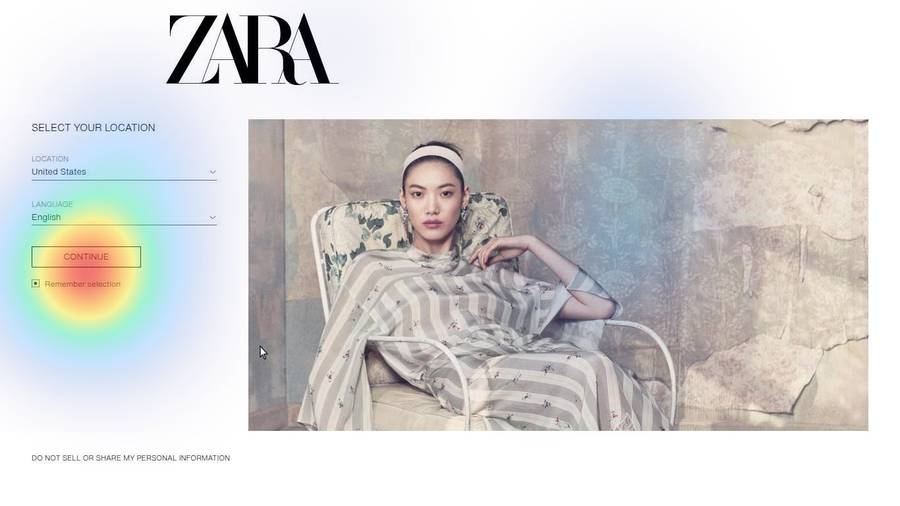

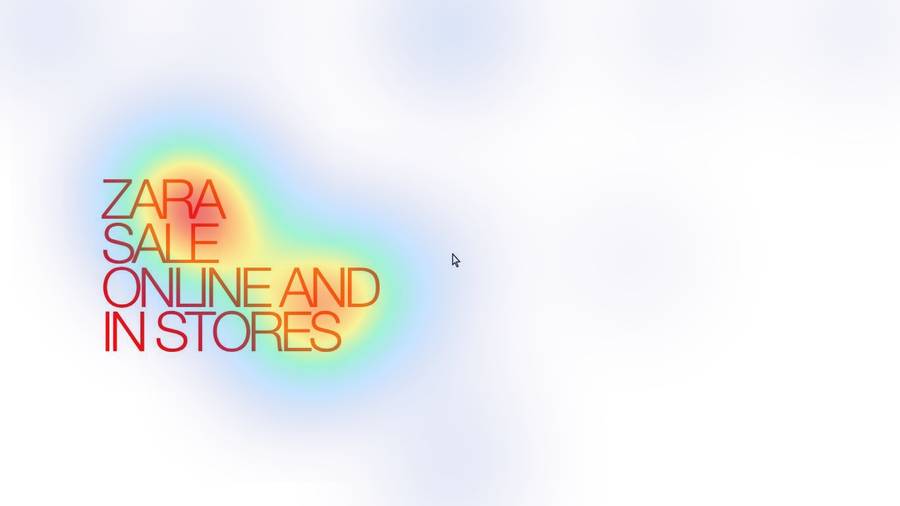


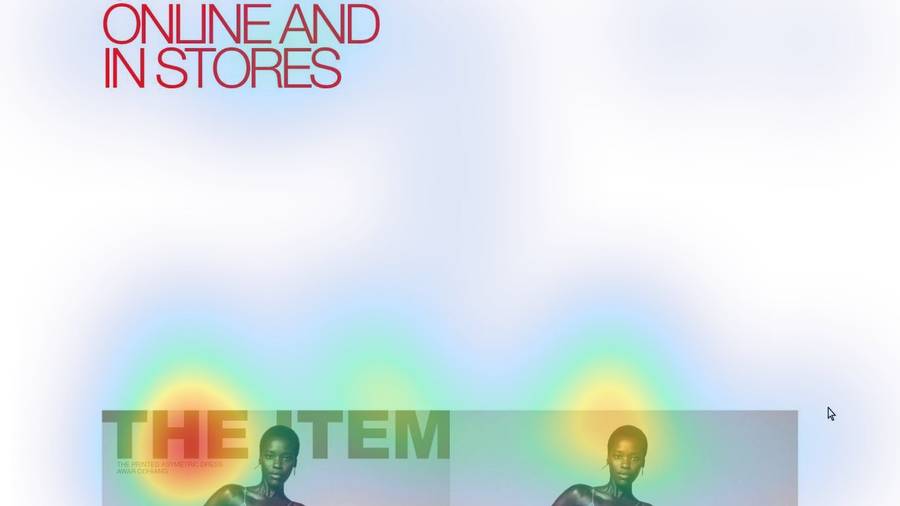

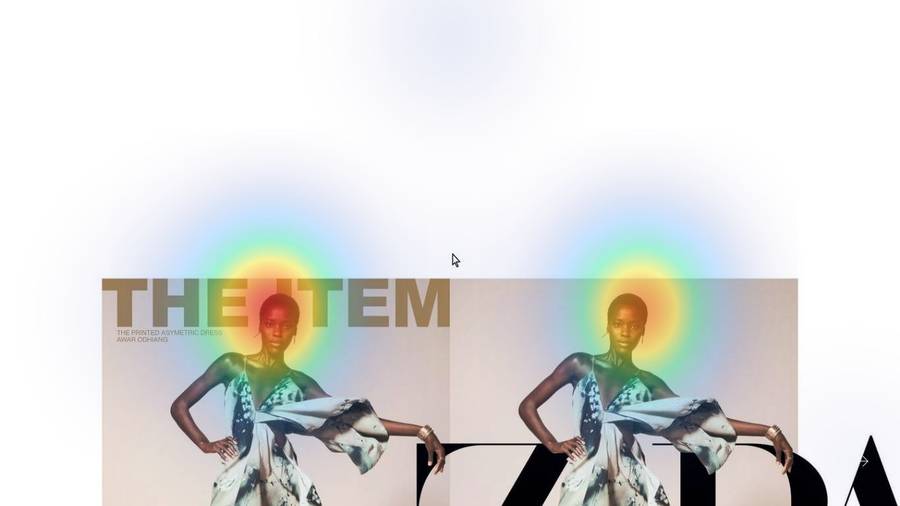
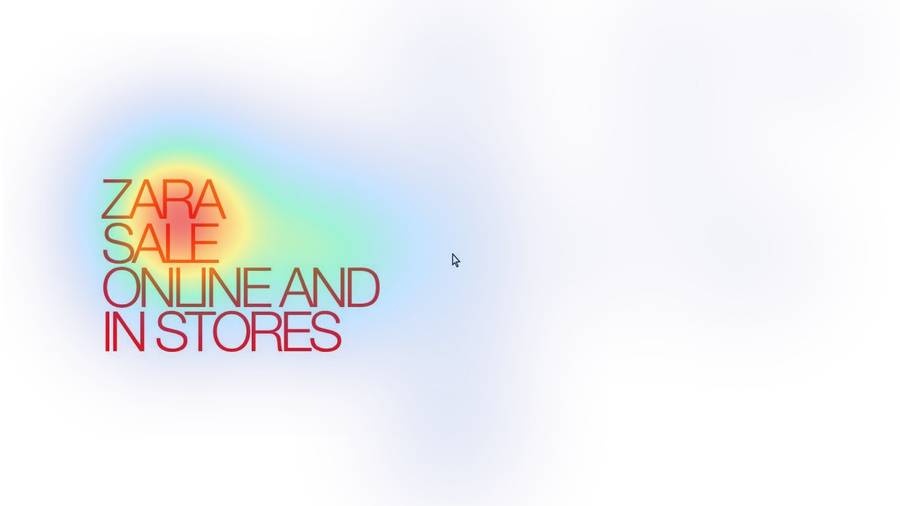
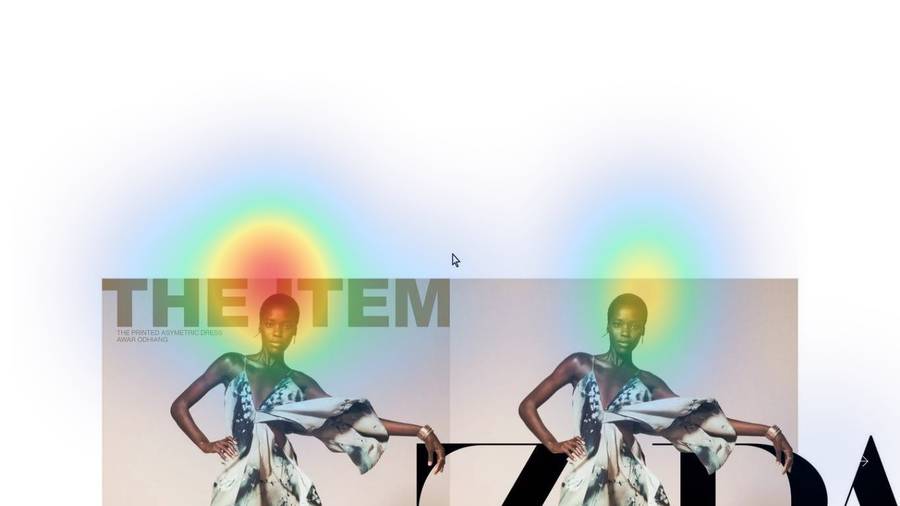
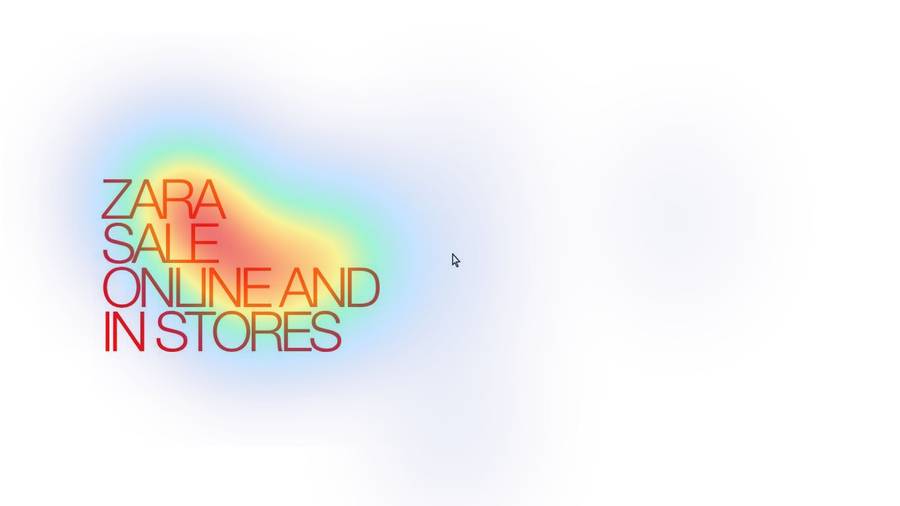
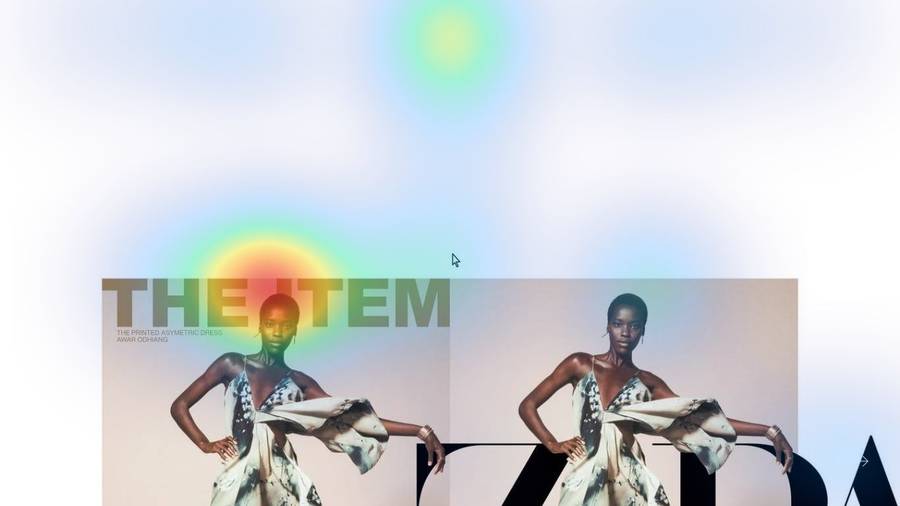

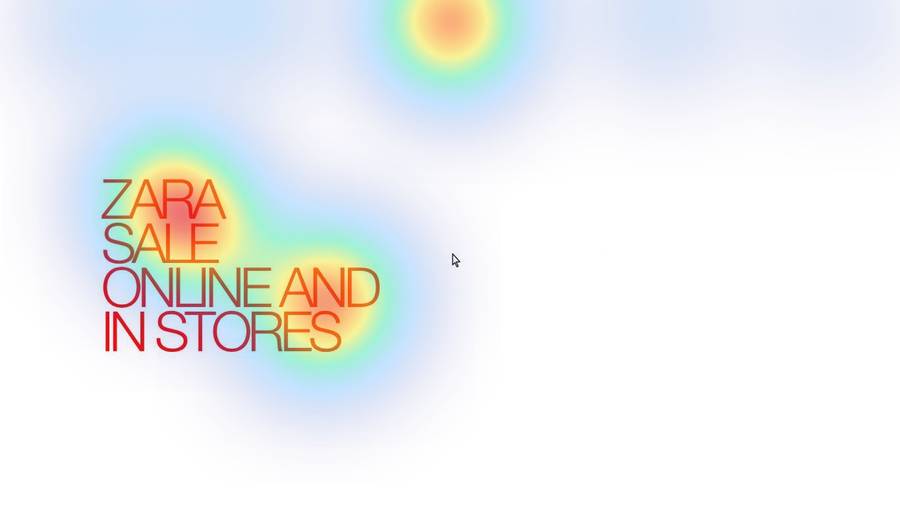
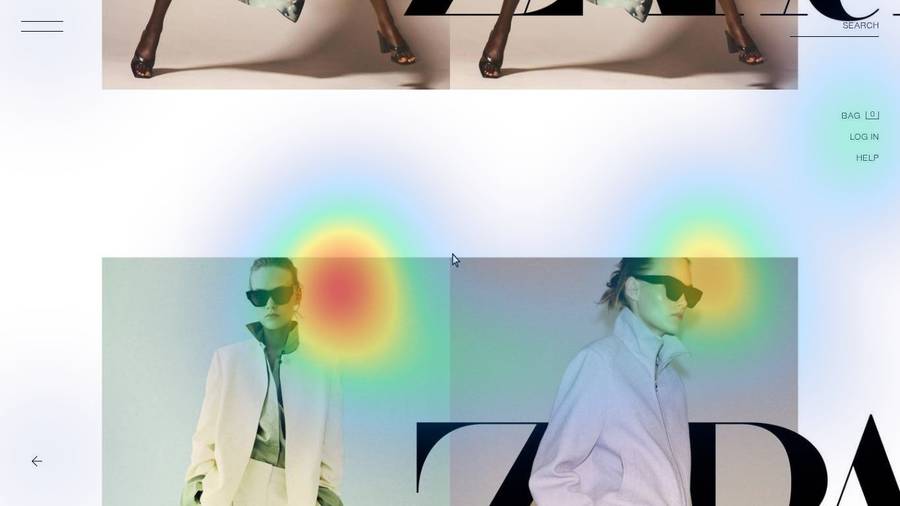

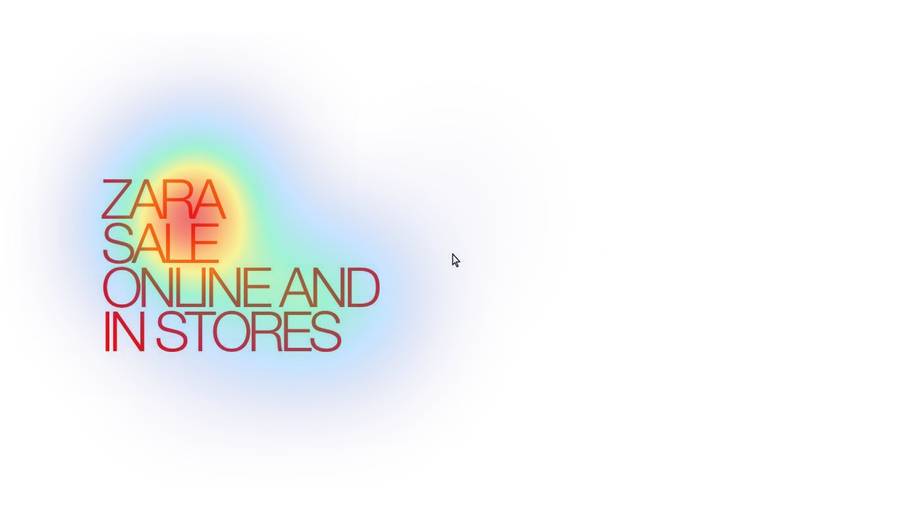
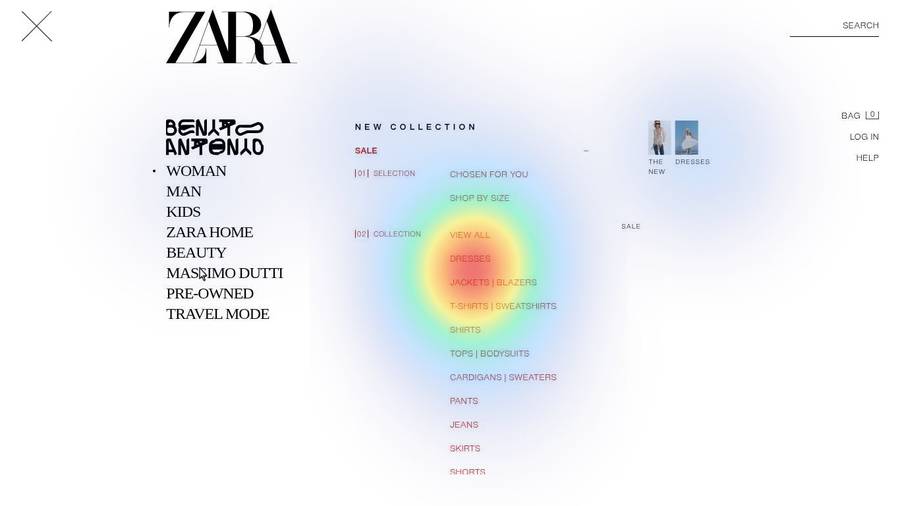

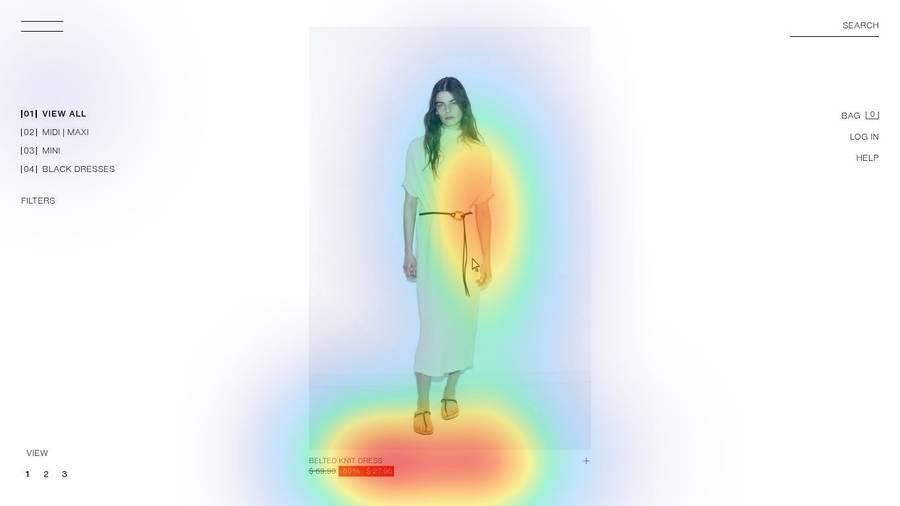
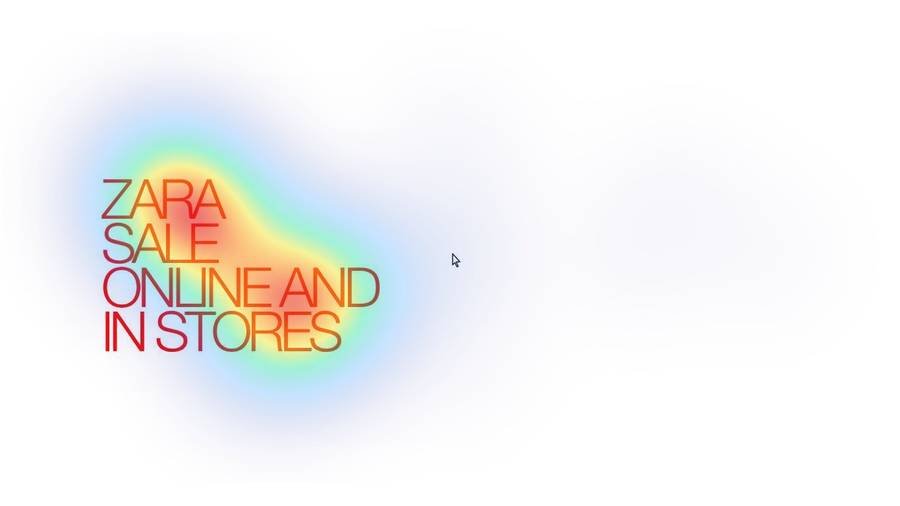
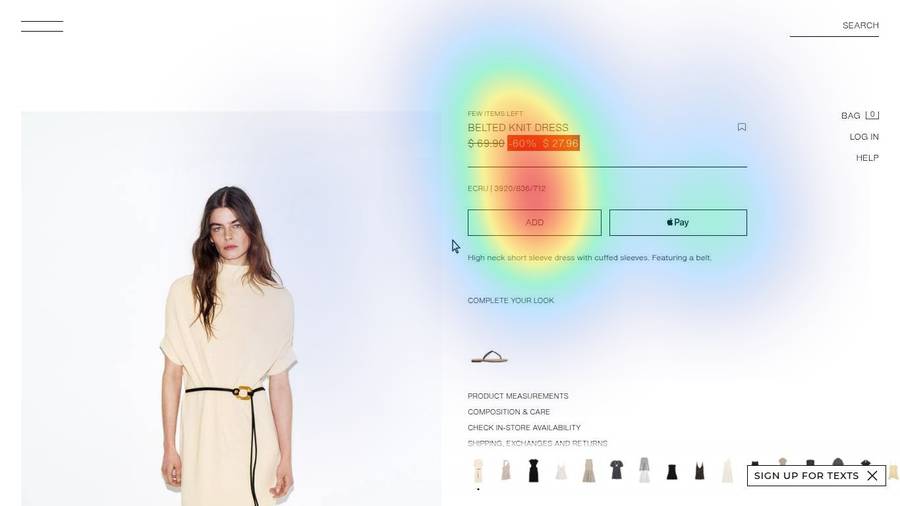
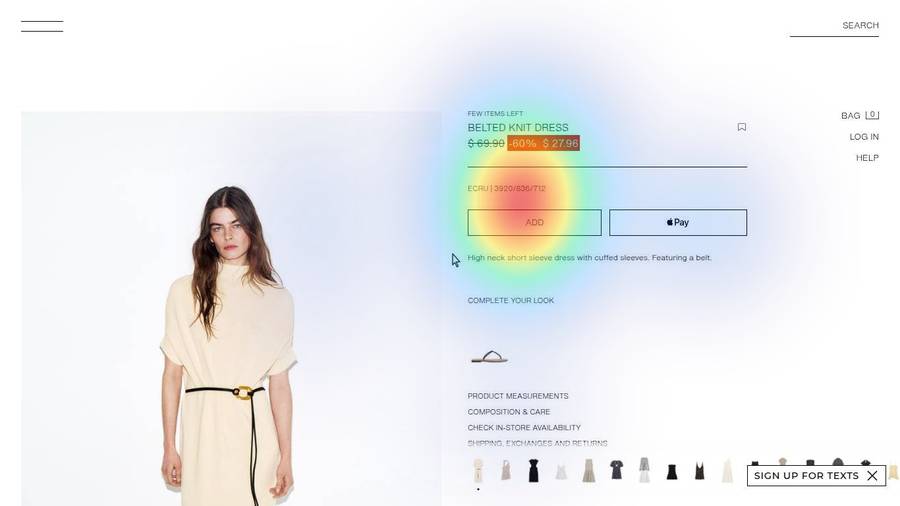
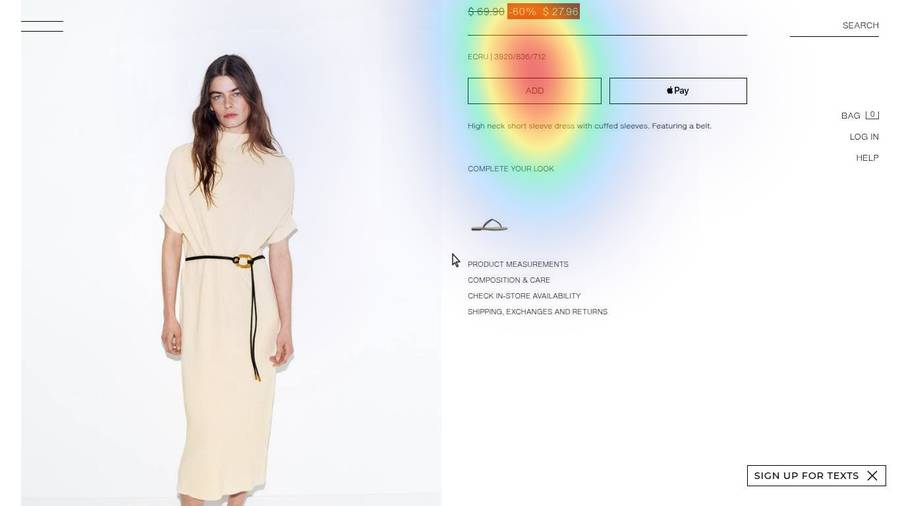
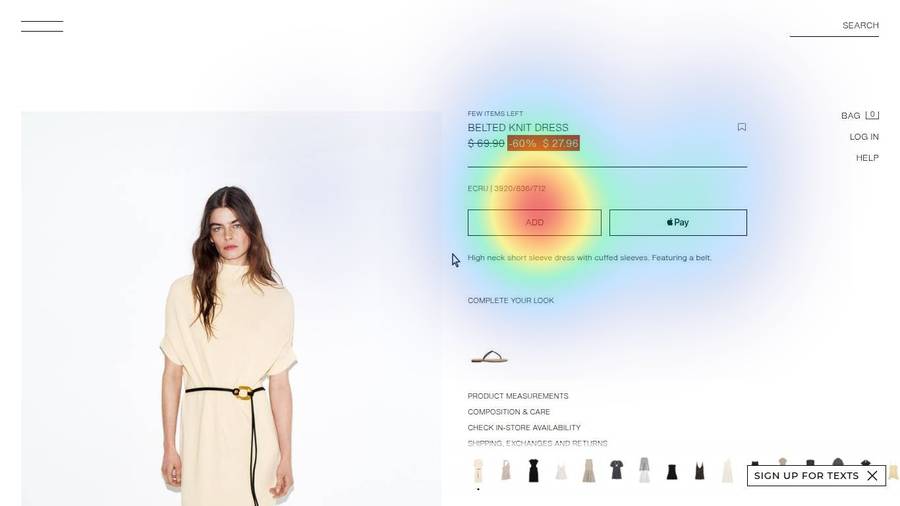
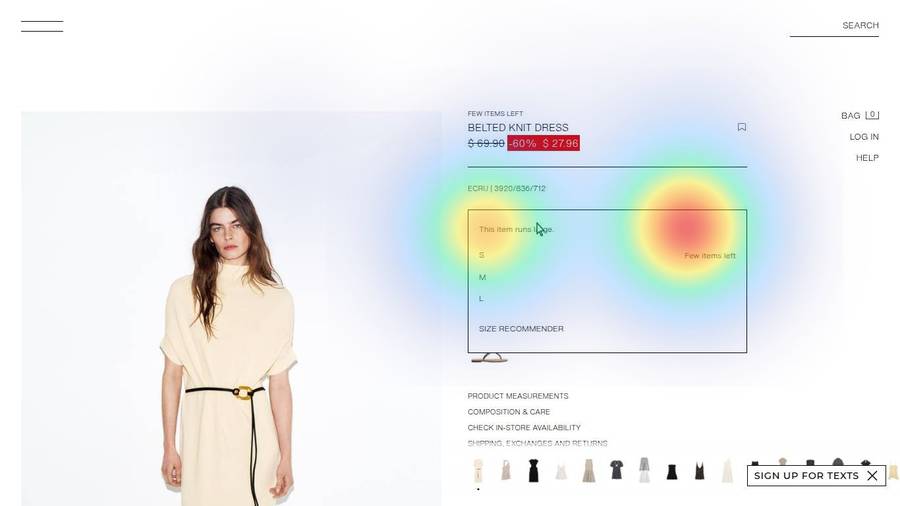
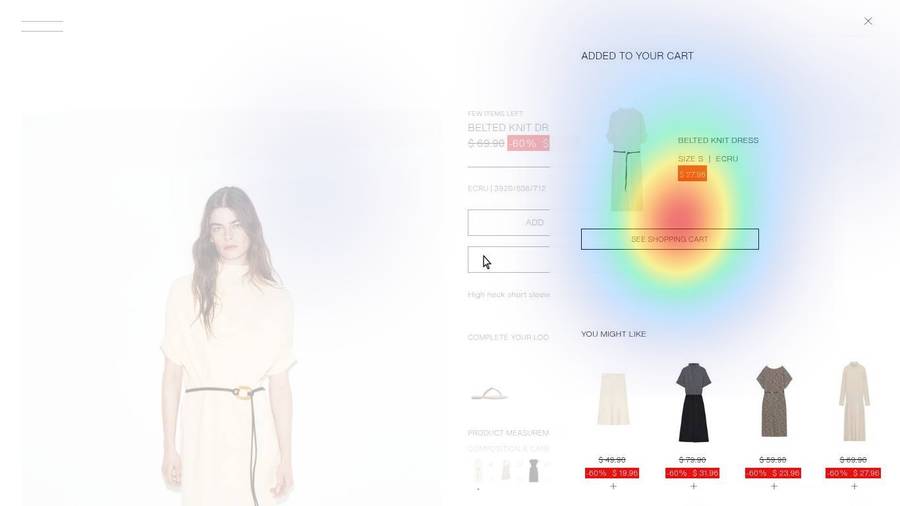
Use the back and forward arrows above the image to move through all 30 screens. You can also swipe.
Live from a real user-testing session: Amina's 30 screens, each with her predicted-gaze heatmap and what she was thinking at that moment. Drag through it or use the arrows to walk screen by screen through her session.
Interfaces are where the validation stands on the deepest ground truth. Desktop, mobile, and web screens are the most-studied territory in public eye-tracking research. The journey side of the product inherits the strongest evidence base we have.
Conclusion
Attention evidence used to be a trade-off: real eyes in a lab for one study a quarter, or one generic heatmap of a viewer who doesn't exist. Synthetic Users now ships the third option, and we believe it's the first of its kind: per-participant predicted attention, validated against real human eye-tracking, at 78% of a real participant's own consistency, for every participant, on every image, instantly with each map tied to the participant's own words about why.
Henruque Rodrigues - Research